Chart Vizzard
Vizzlo's AI-based chart generatorEssential Project Management Chart Templates you need to know
Project management is the methodical design of processes. It describes a comprehensive organizational and operational concept that enables complex projects to be completed on time, cost-effectively, and with the required quality. It contains the organization and all tools for planning, coordination, steering and controlling of the intended project.
To fulfill the complex and unique assignment within the constrained time and cost, various tools and techniques are employed. In this guide, we will show you essential visualizations that anybody should be aware of.
Gantt Chart
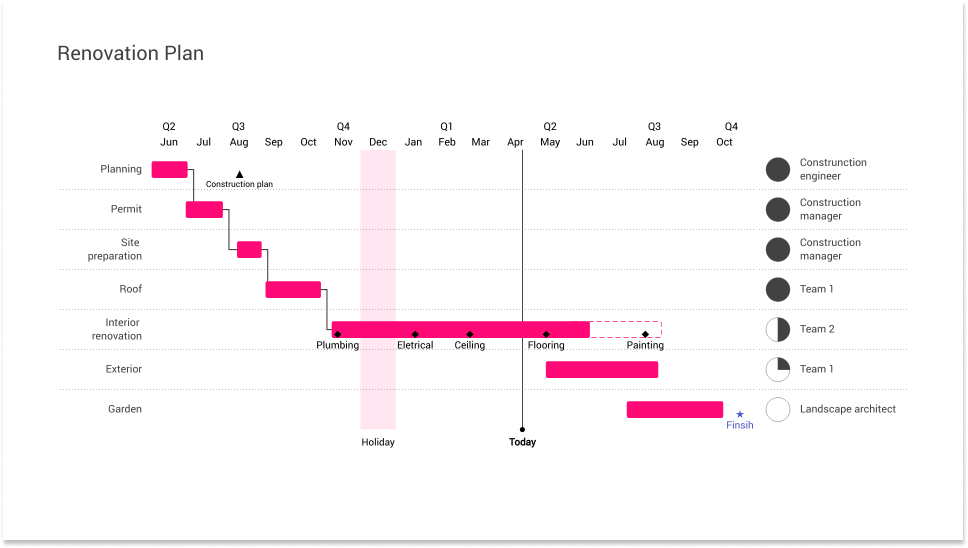
Professionals use Gantt charts to visualize how highly complex tasks can be broken down into smaller processes. It is one of the most popular and most effective ways to show a project’s timeline. A Gantt chart shows you what has to be done and when. You can assign responsibility for given tasks by recording who will deliver them. Tasks or events are displayed from top to bottom against time. Bars represent tasks as part of an activity. From the position and length of the bar, you can see the start date, duration, and end date of the task. This allows you to see the whole project at a glance and see what should be happening when.
Timeline
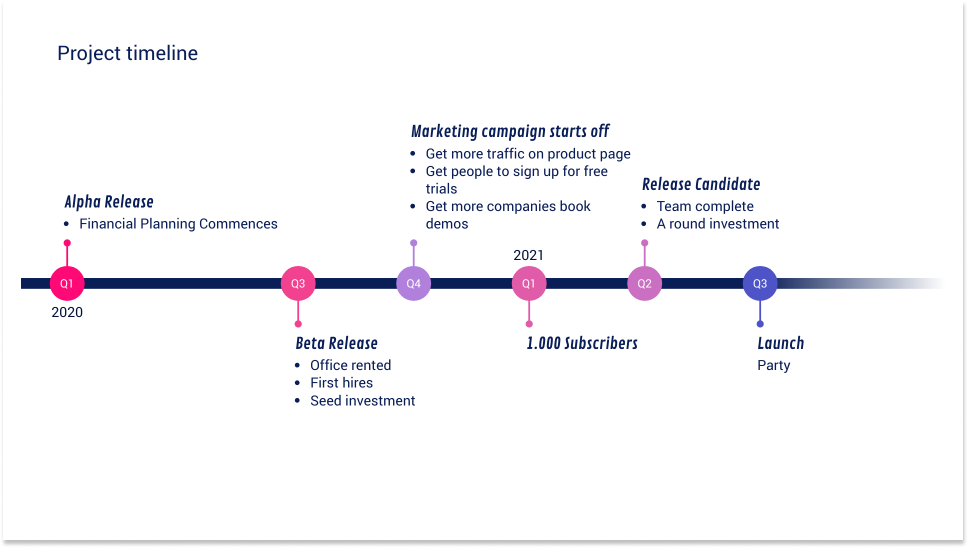
A project timeline helps to set clear directions and priorities, in which small actionable steps are visualized as milestones that lead to your main goal. Break a complex project down into smaller steps. A timeline displays milestones in a chronological order to effectively visualize information over time. Timelines provide a great way for you and your team to stay up-to-date on everything that is happening.
Whether you need it for project management purposes, to illustrate legal cases, or to outline historical events.
Waterfall Chart
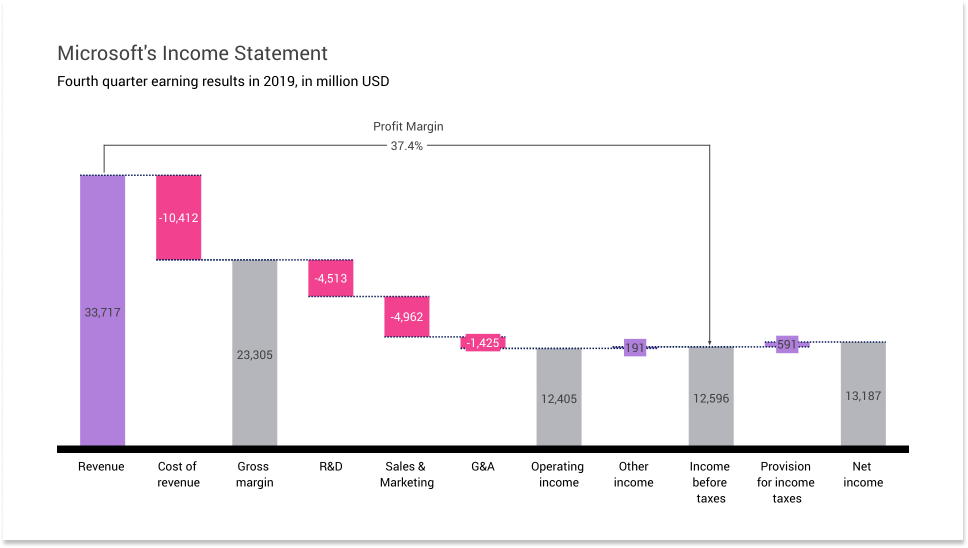
Waterfall charts are widely adopted in accounting and sales, as well as in management. It is regularly used by strategic consulting firms to analyze cash flows. It is used as an instrument to estimate the value of a company to address key questions that can come up from stakeholders.
A typical use-case of a waterfall chart is the so-called EBITDA bridge to analyze business performances. That is a breakdown of individual components that contribute to the movement in a company’s EBITDA. A Waterfall chart quickly and effectively shows the drivers of profitability. Waterfall charts are a tool to alleviate some burden to layout easy-to-follow explanations of business performance.
Control Chart
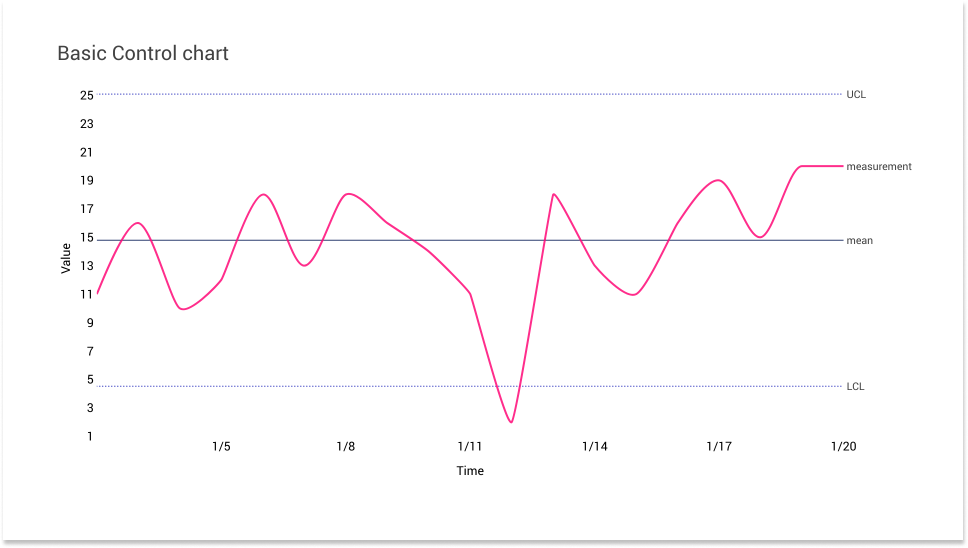
A control chart shows the changes in the process over time. Control charts, also known as Shewhart charts or process-behavior charts, are a tool used to determine if a (business) process is in a state of control. Control charts are the graphical device for Statistical Process Monitoring.
Project Phase Chart
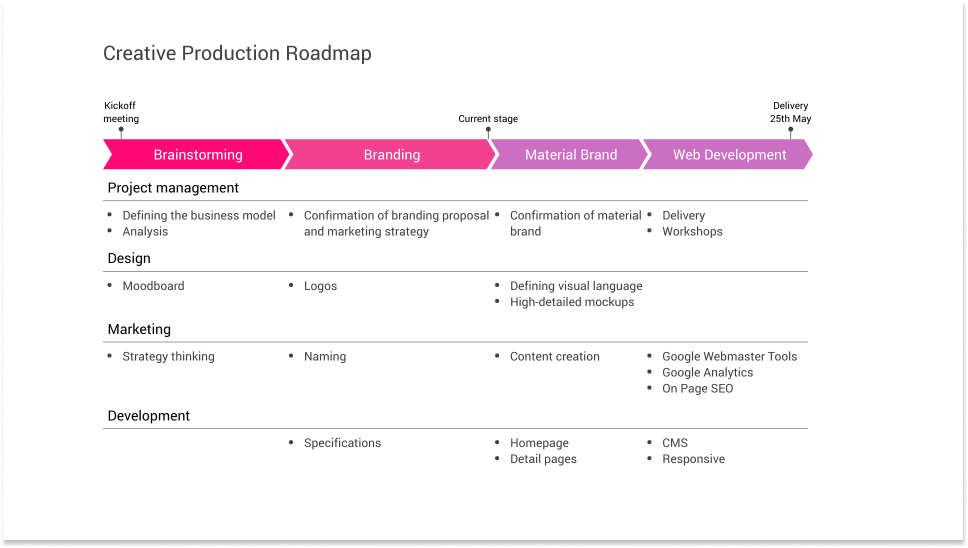
A project phase chart, sometimes just “process chart,” is a detailed chevron list to visualize sequential project phases or process flows. Visually dividing projects or complex processes into phases and defining activities and deliverables for each of them will help your team to meet all requirements at the end. The flexible structure of this chart allows you to segment the phases into groups of processes or activities and to visualize the whole project life cycle effectively. You can either organize the chevrons vertically or horizontally.
Organizational Chart
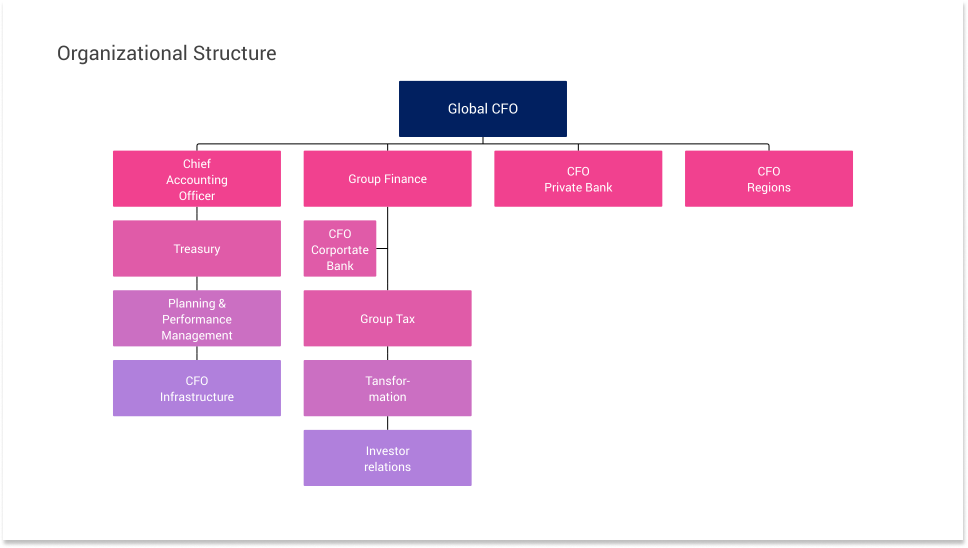
The organizational chart is a very straightforward and intelligible plan that shows the whole structure of organizations and the relationships between their hierarchical levels. It allows you to visualize formal relations of subordination within your company or department, like who are the managers and their teams, or from whom the chief executive shall expect reports. In project management and systems engineering, the chart is also referred to as a work breakdown structure. Use it to provide the hierarchy of tasks that is part of your project.
Besides, use this diagram also to map family trees, language groups, or fields of knowledge.
Milestones As Arrow
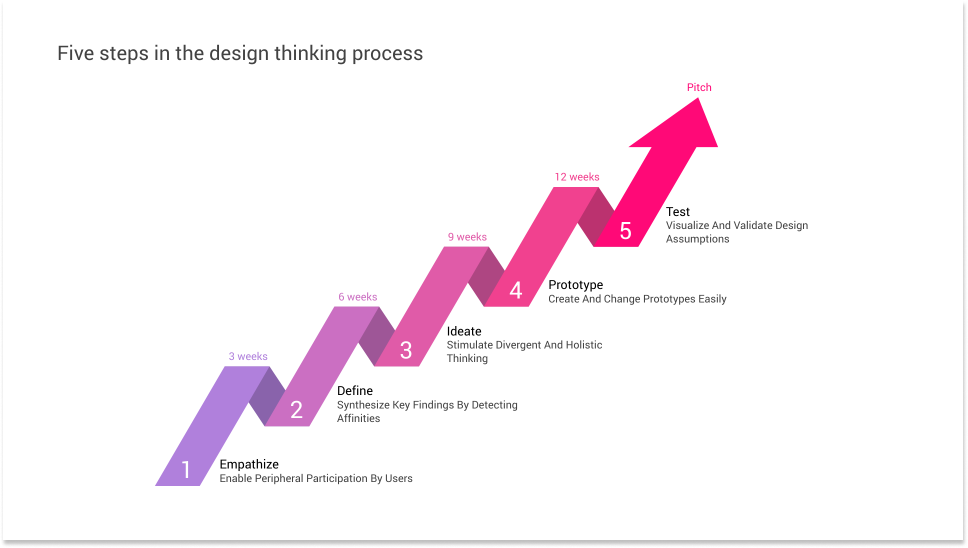
Milestones are essential events in a project. Milestone planning is focused on milestones and is goal-directed and results-oriented. This type of visualizations highlights exactly that.
Feedback Loop
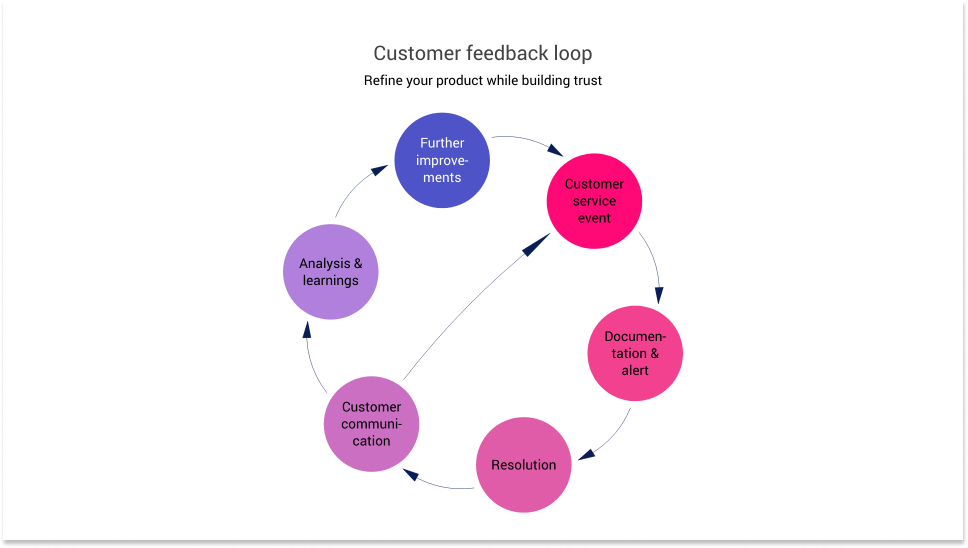
Project managers are in a constant flow. This chart is a visual aid to understand the project cycle at its core. At a very high level, this circular diagram will help you to communicate the status quo of your project.
The concept of feedback, especially in business is a synonym for an ongoing learning process and a key mechanism for performance improvements.
Roadmap
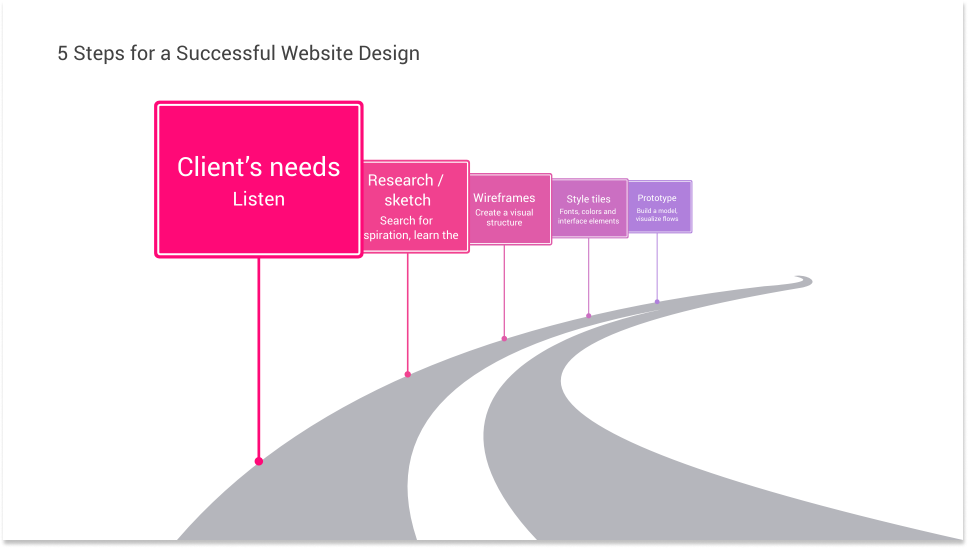
A roadmap is a visual representation of your project plan. It is the perfect tool to plan and provide an overview of your project timeline and its major milestones, in the order that best showcases your strategy.
This chart is ideal for project managers or anybody looking to communicate and monitor the development of plans, and processes. It is also an easy way to share your strategic vision.
Idea Chart
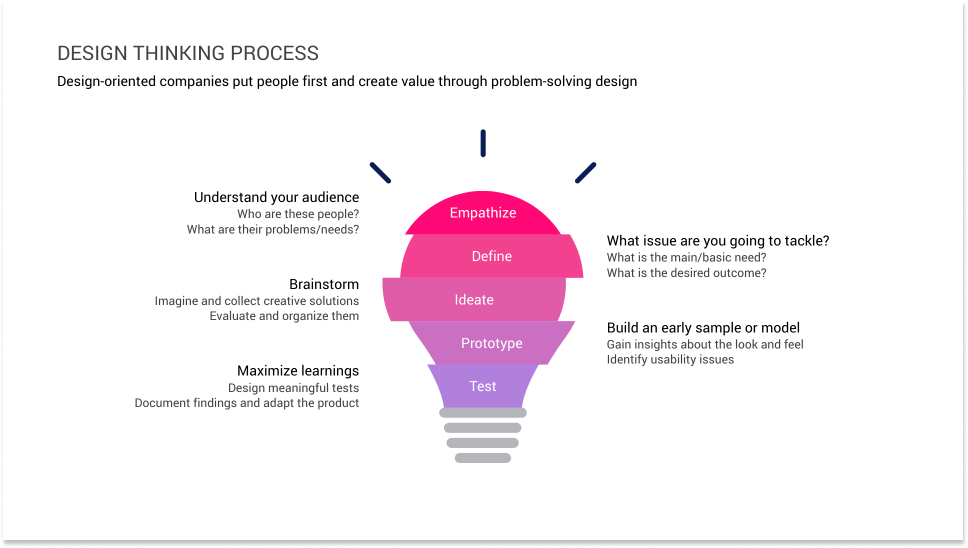
A chart perfect to visualize the creative process during a project. Vizzlo’s variant of the light bulb slide template, which is commonly associated with new ideas.
Start creating your own project management charts.
Try Vizzlo for free