Fill out the form, and we'll get in touch as soon as possible.
Get inspired by these examples of graphs, maps and diagrams created with Vizzlo
Time Series Graph example
Line Graph example
Dot Plot Chart example
Retention Chart example
100% Stacked Area Chart example
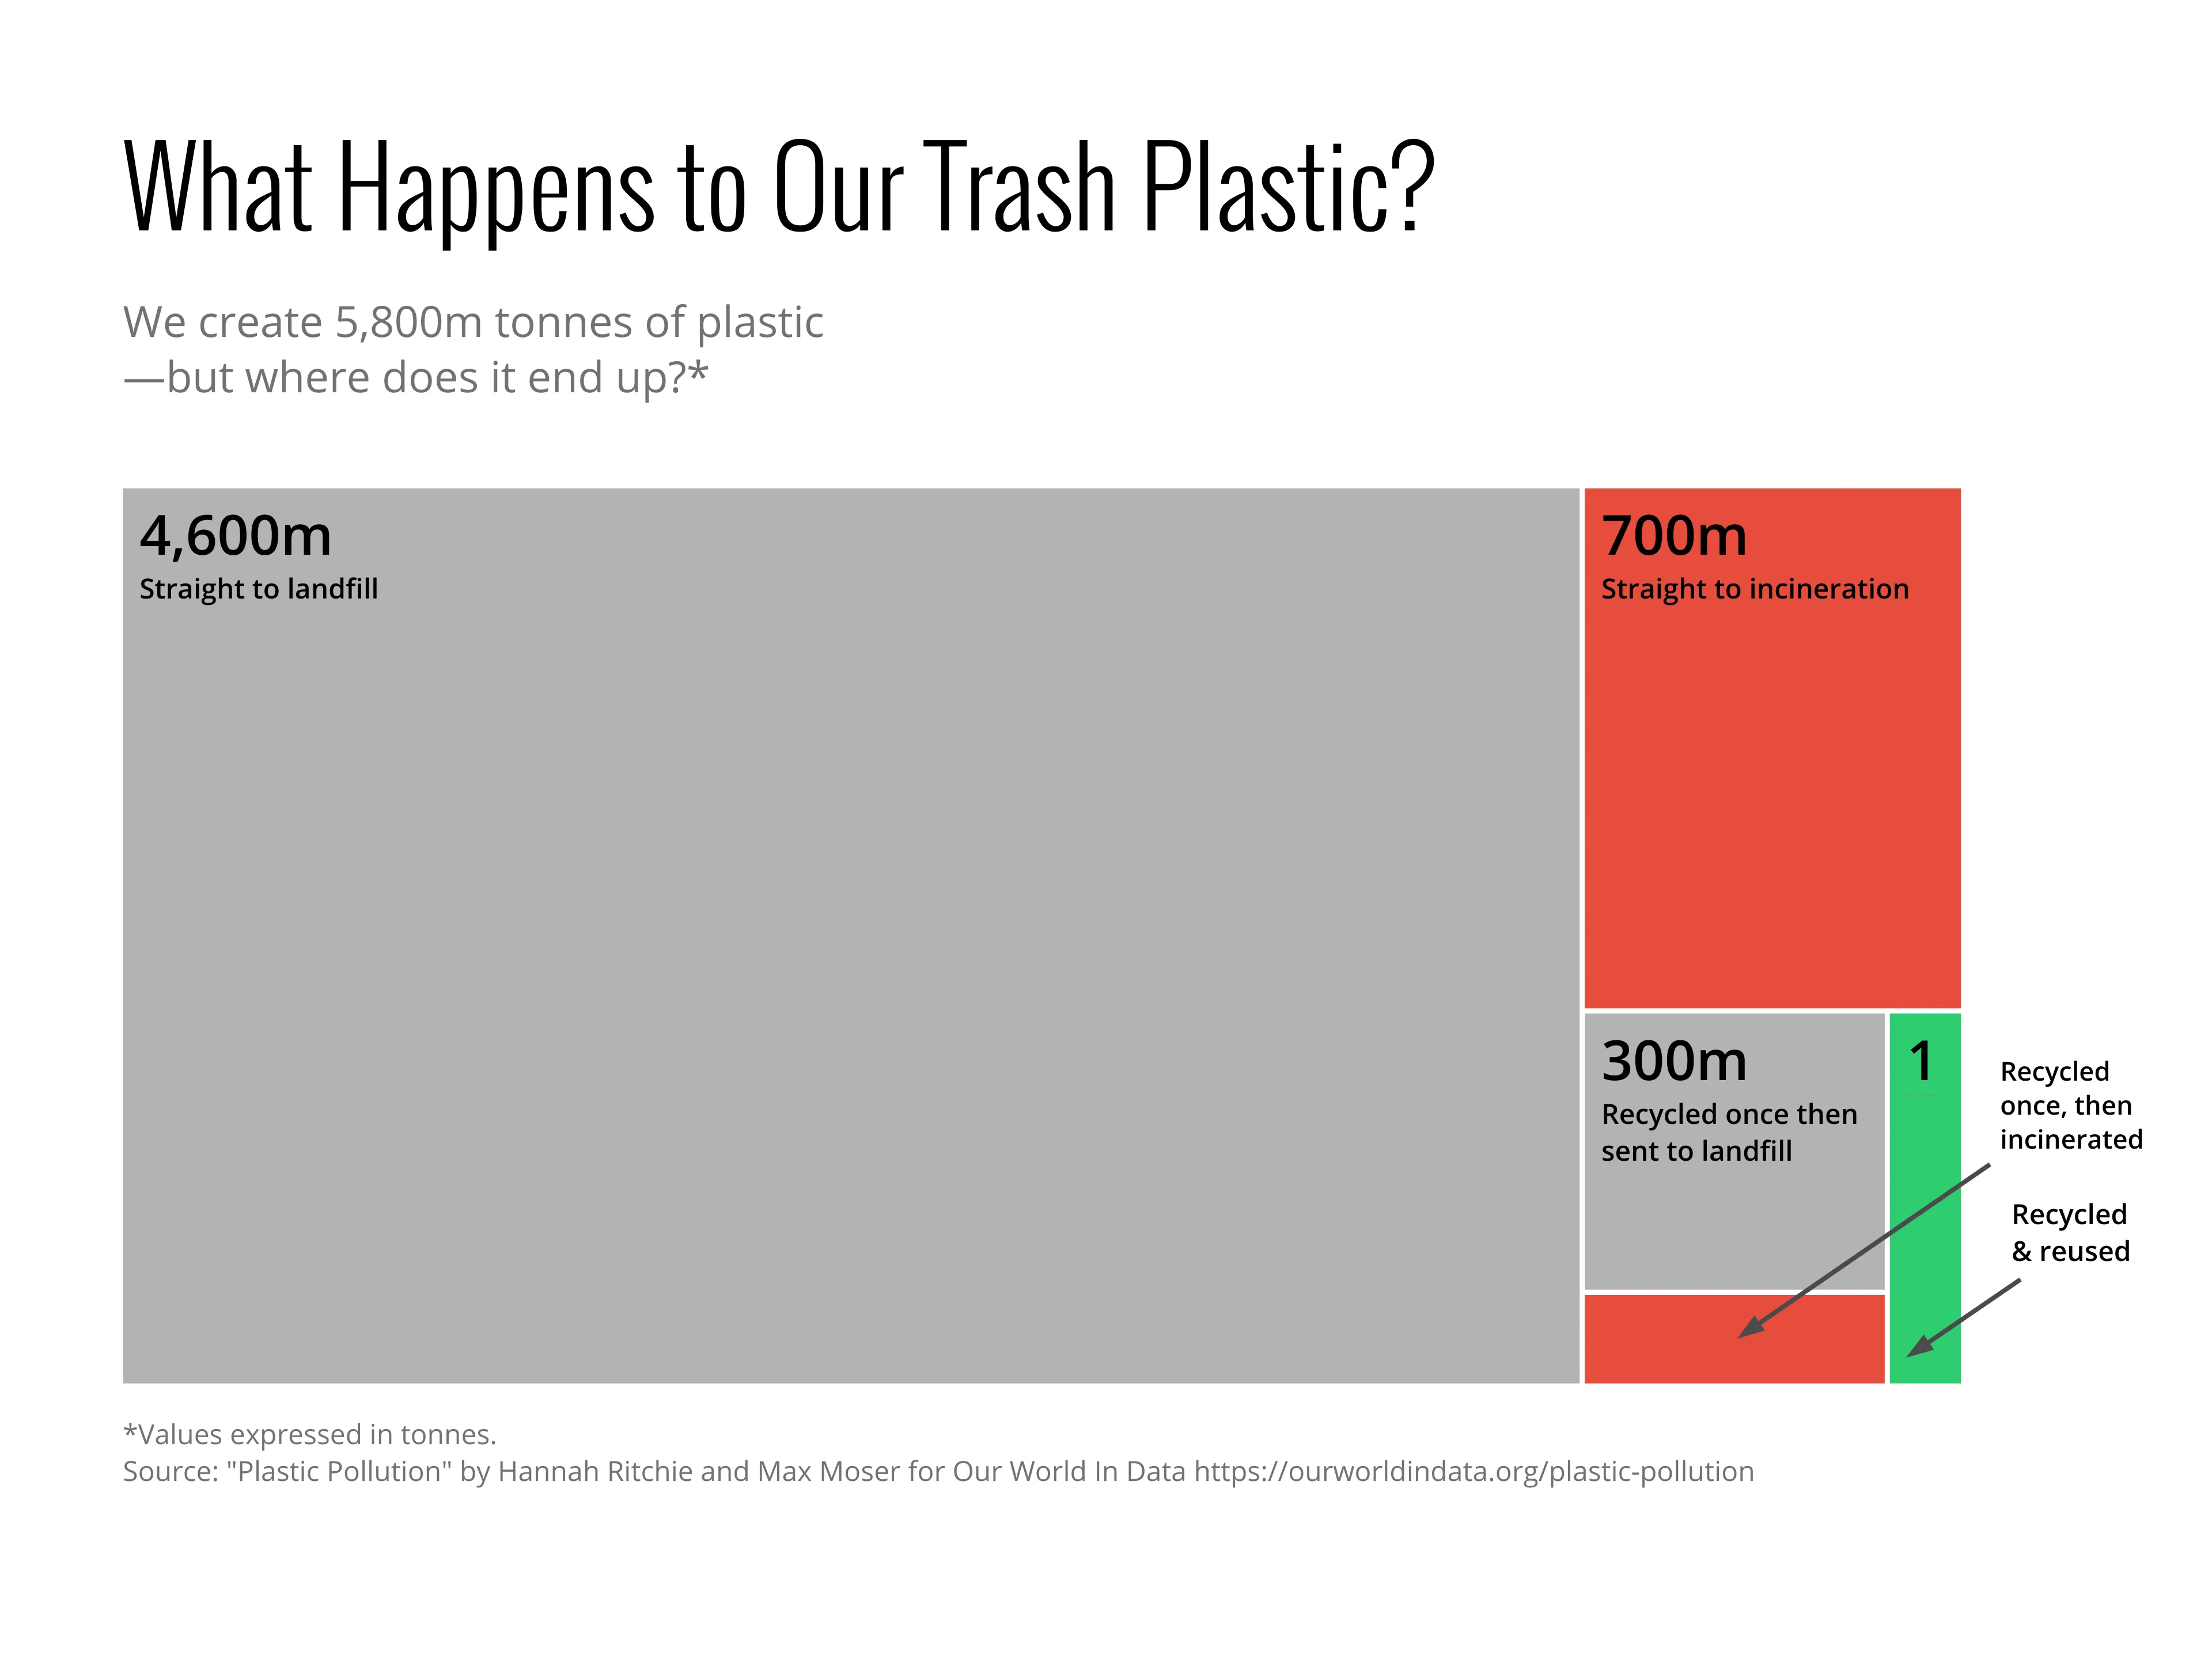
Treemap example
Horizontal Bar Chart example
World Map example
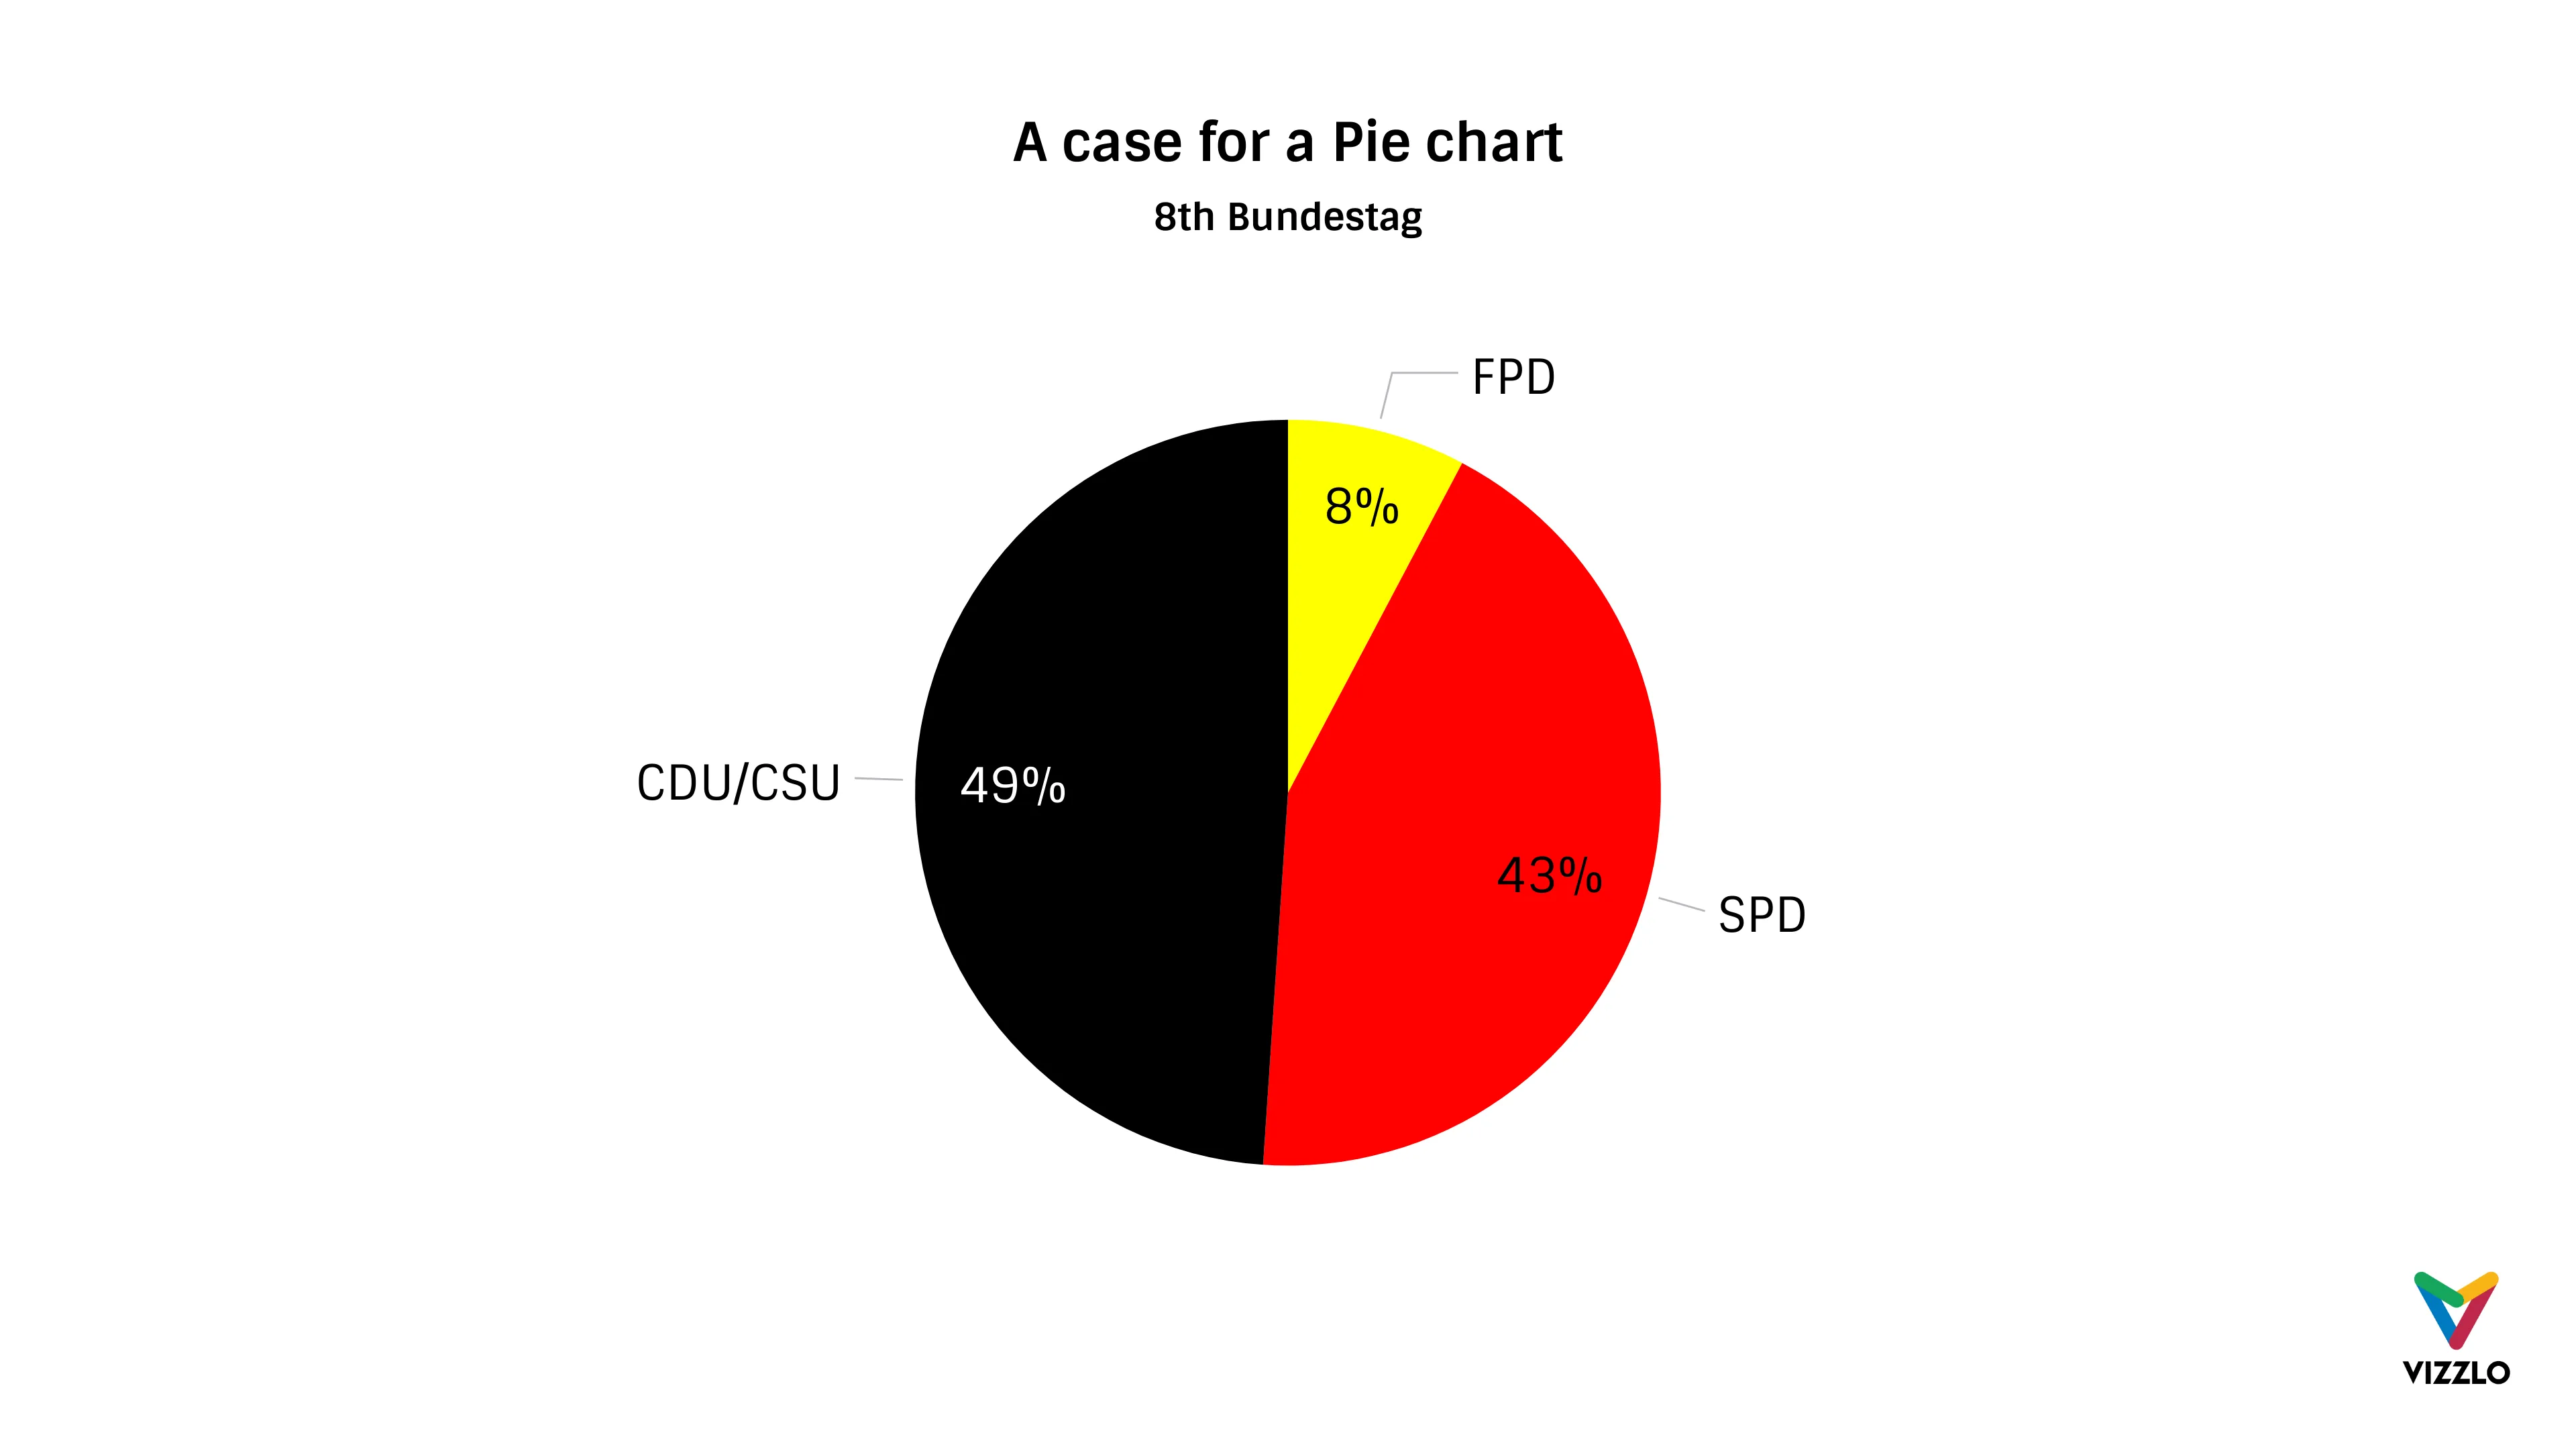
Pie Chart example
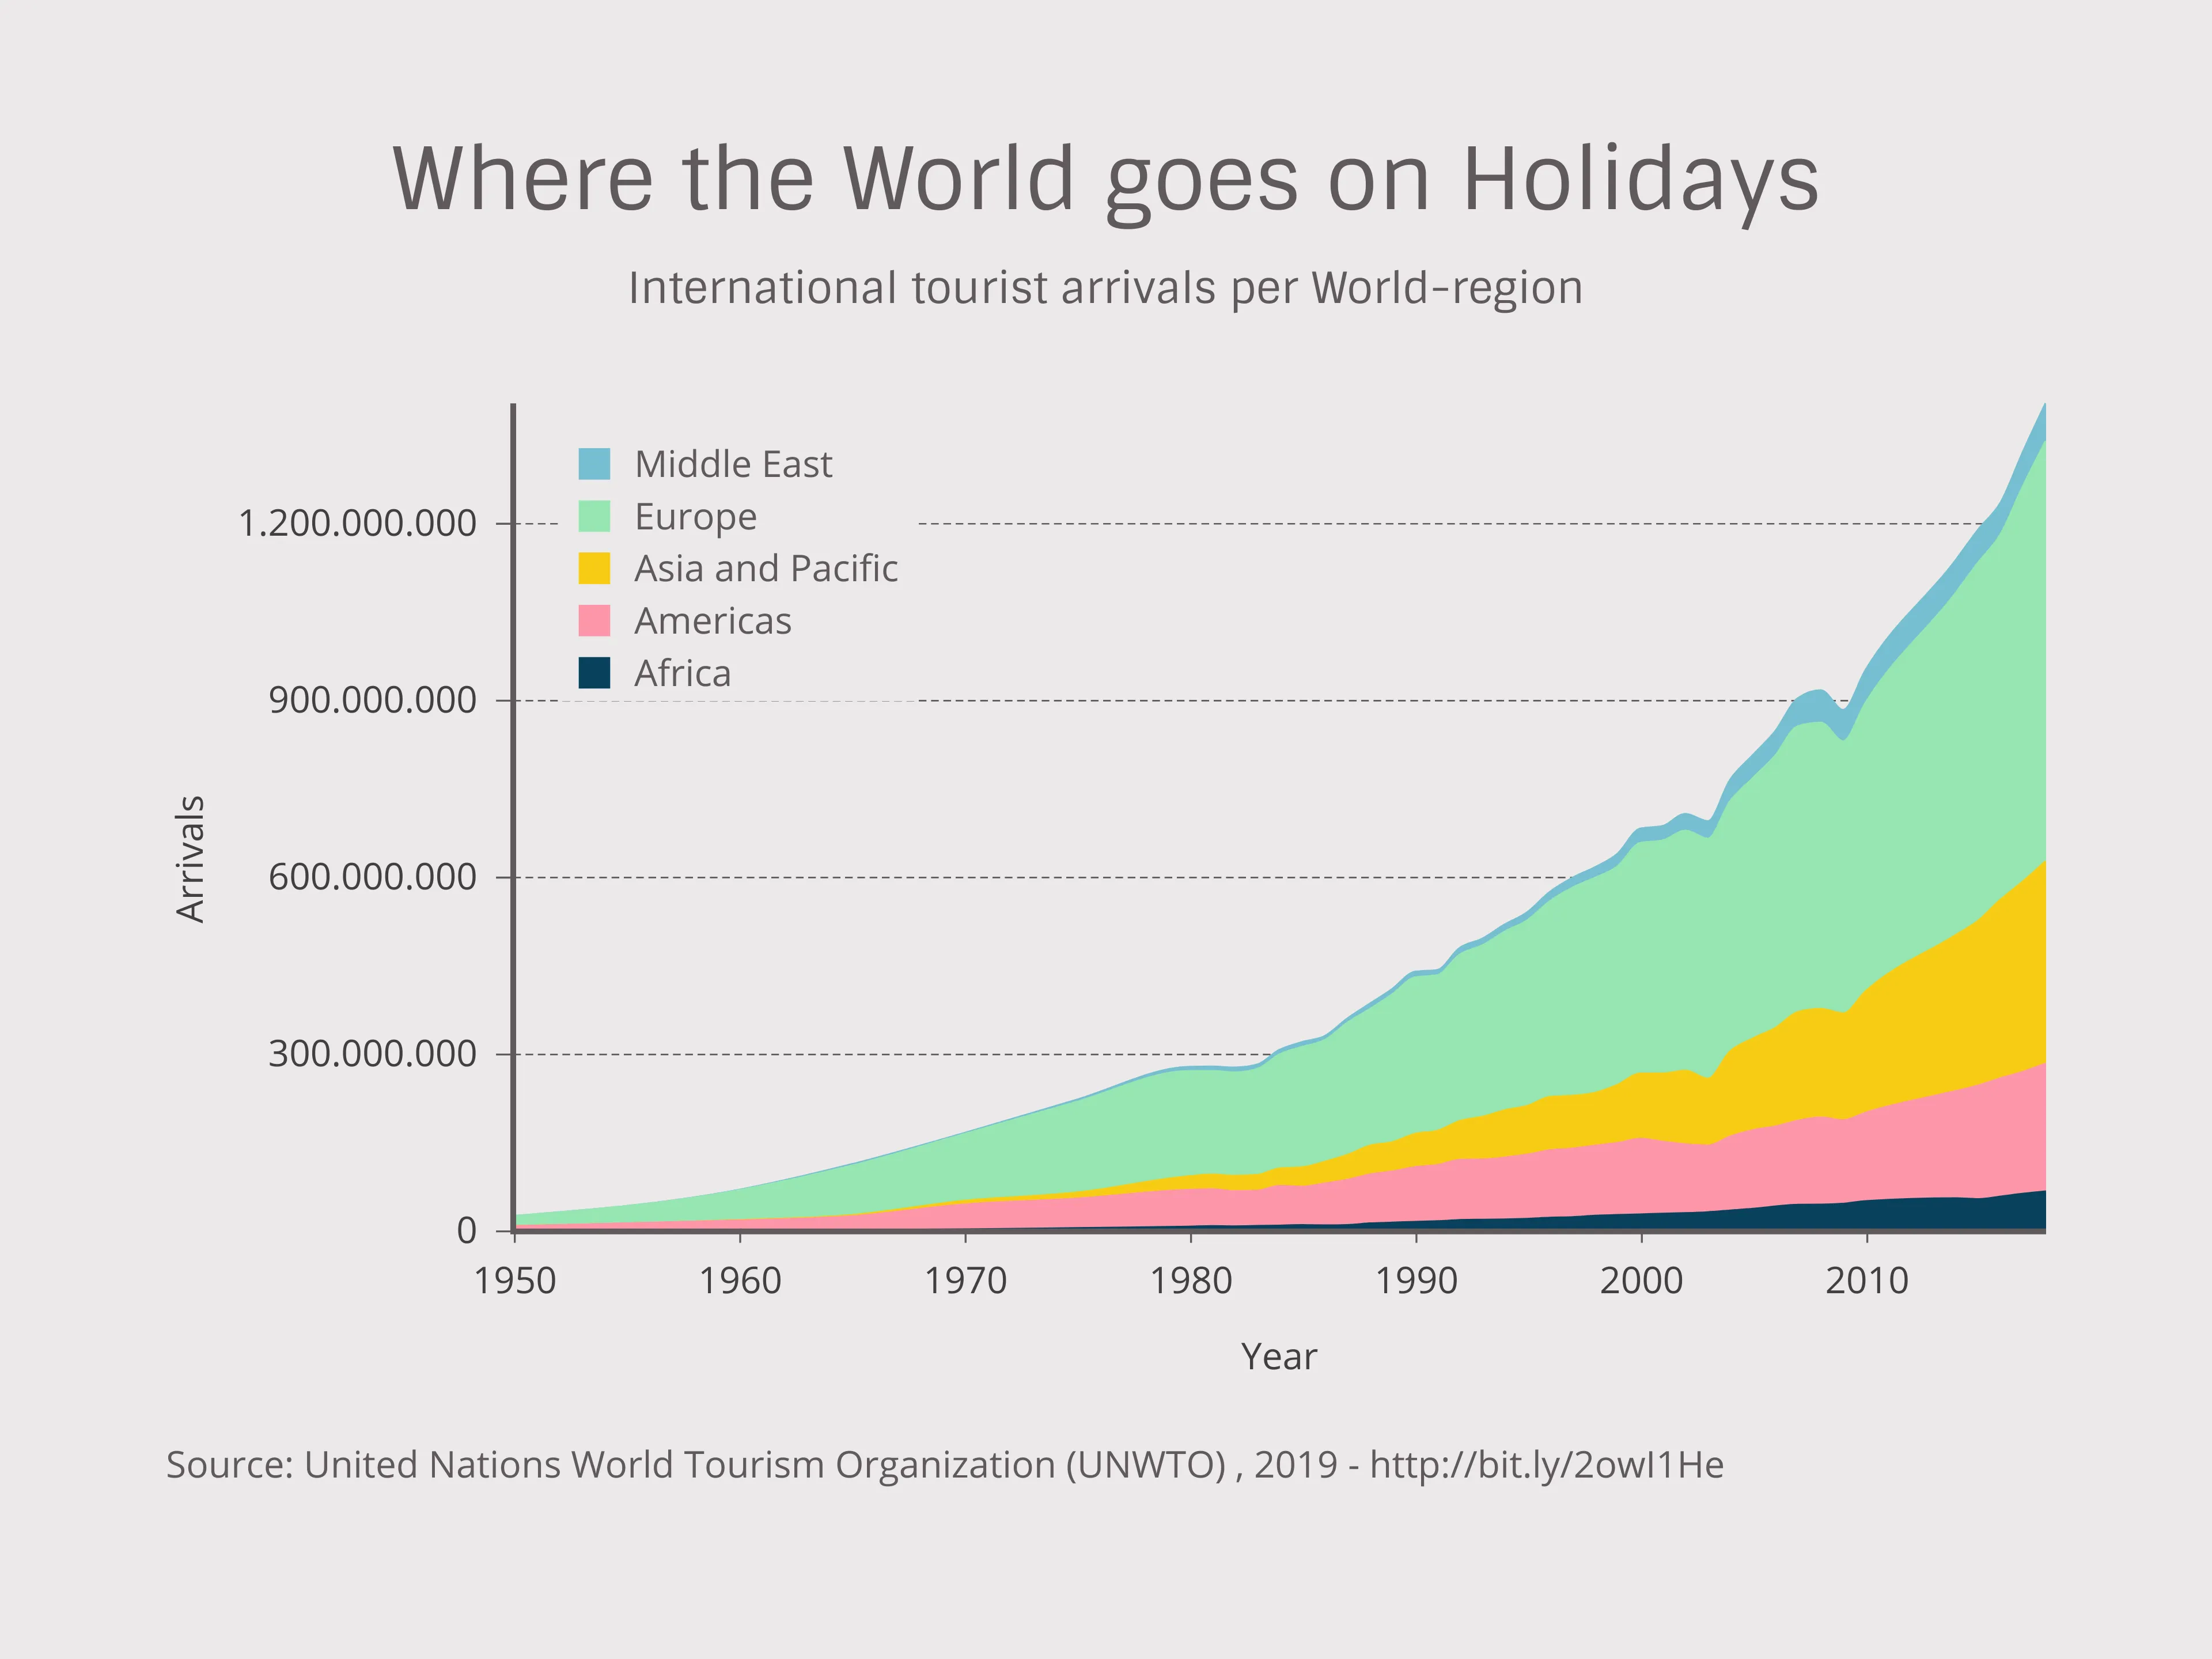
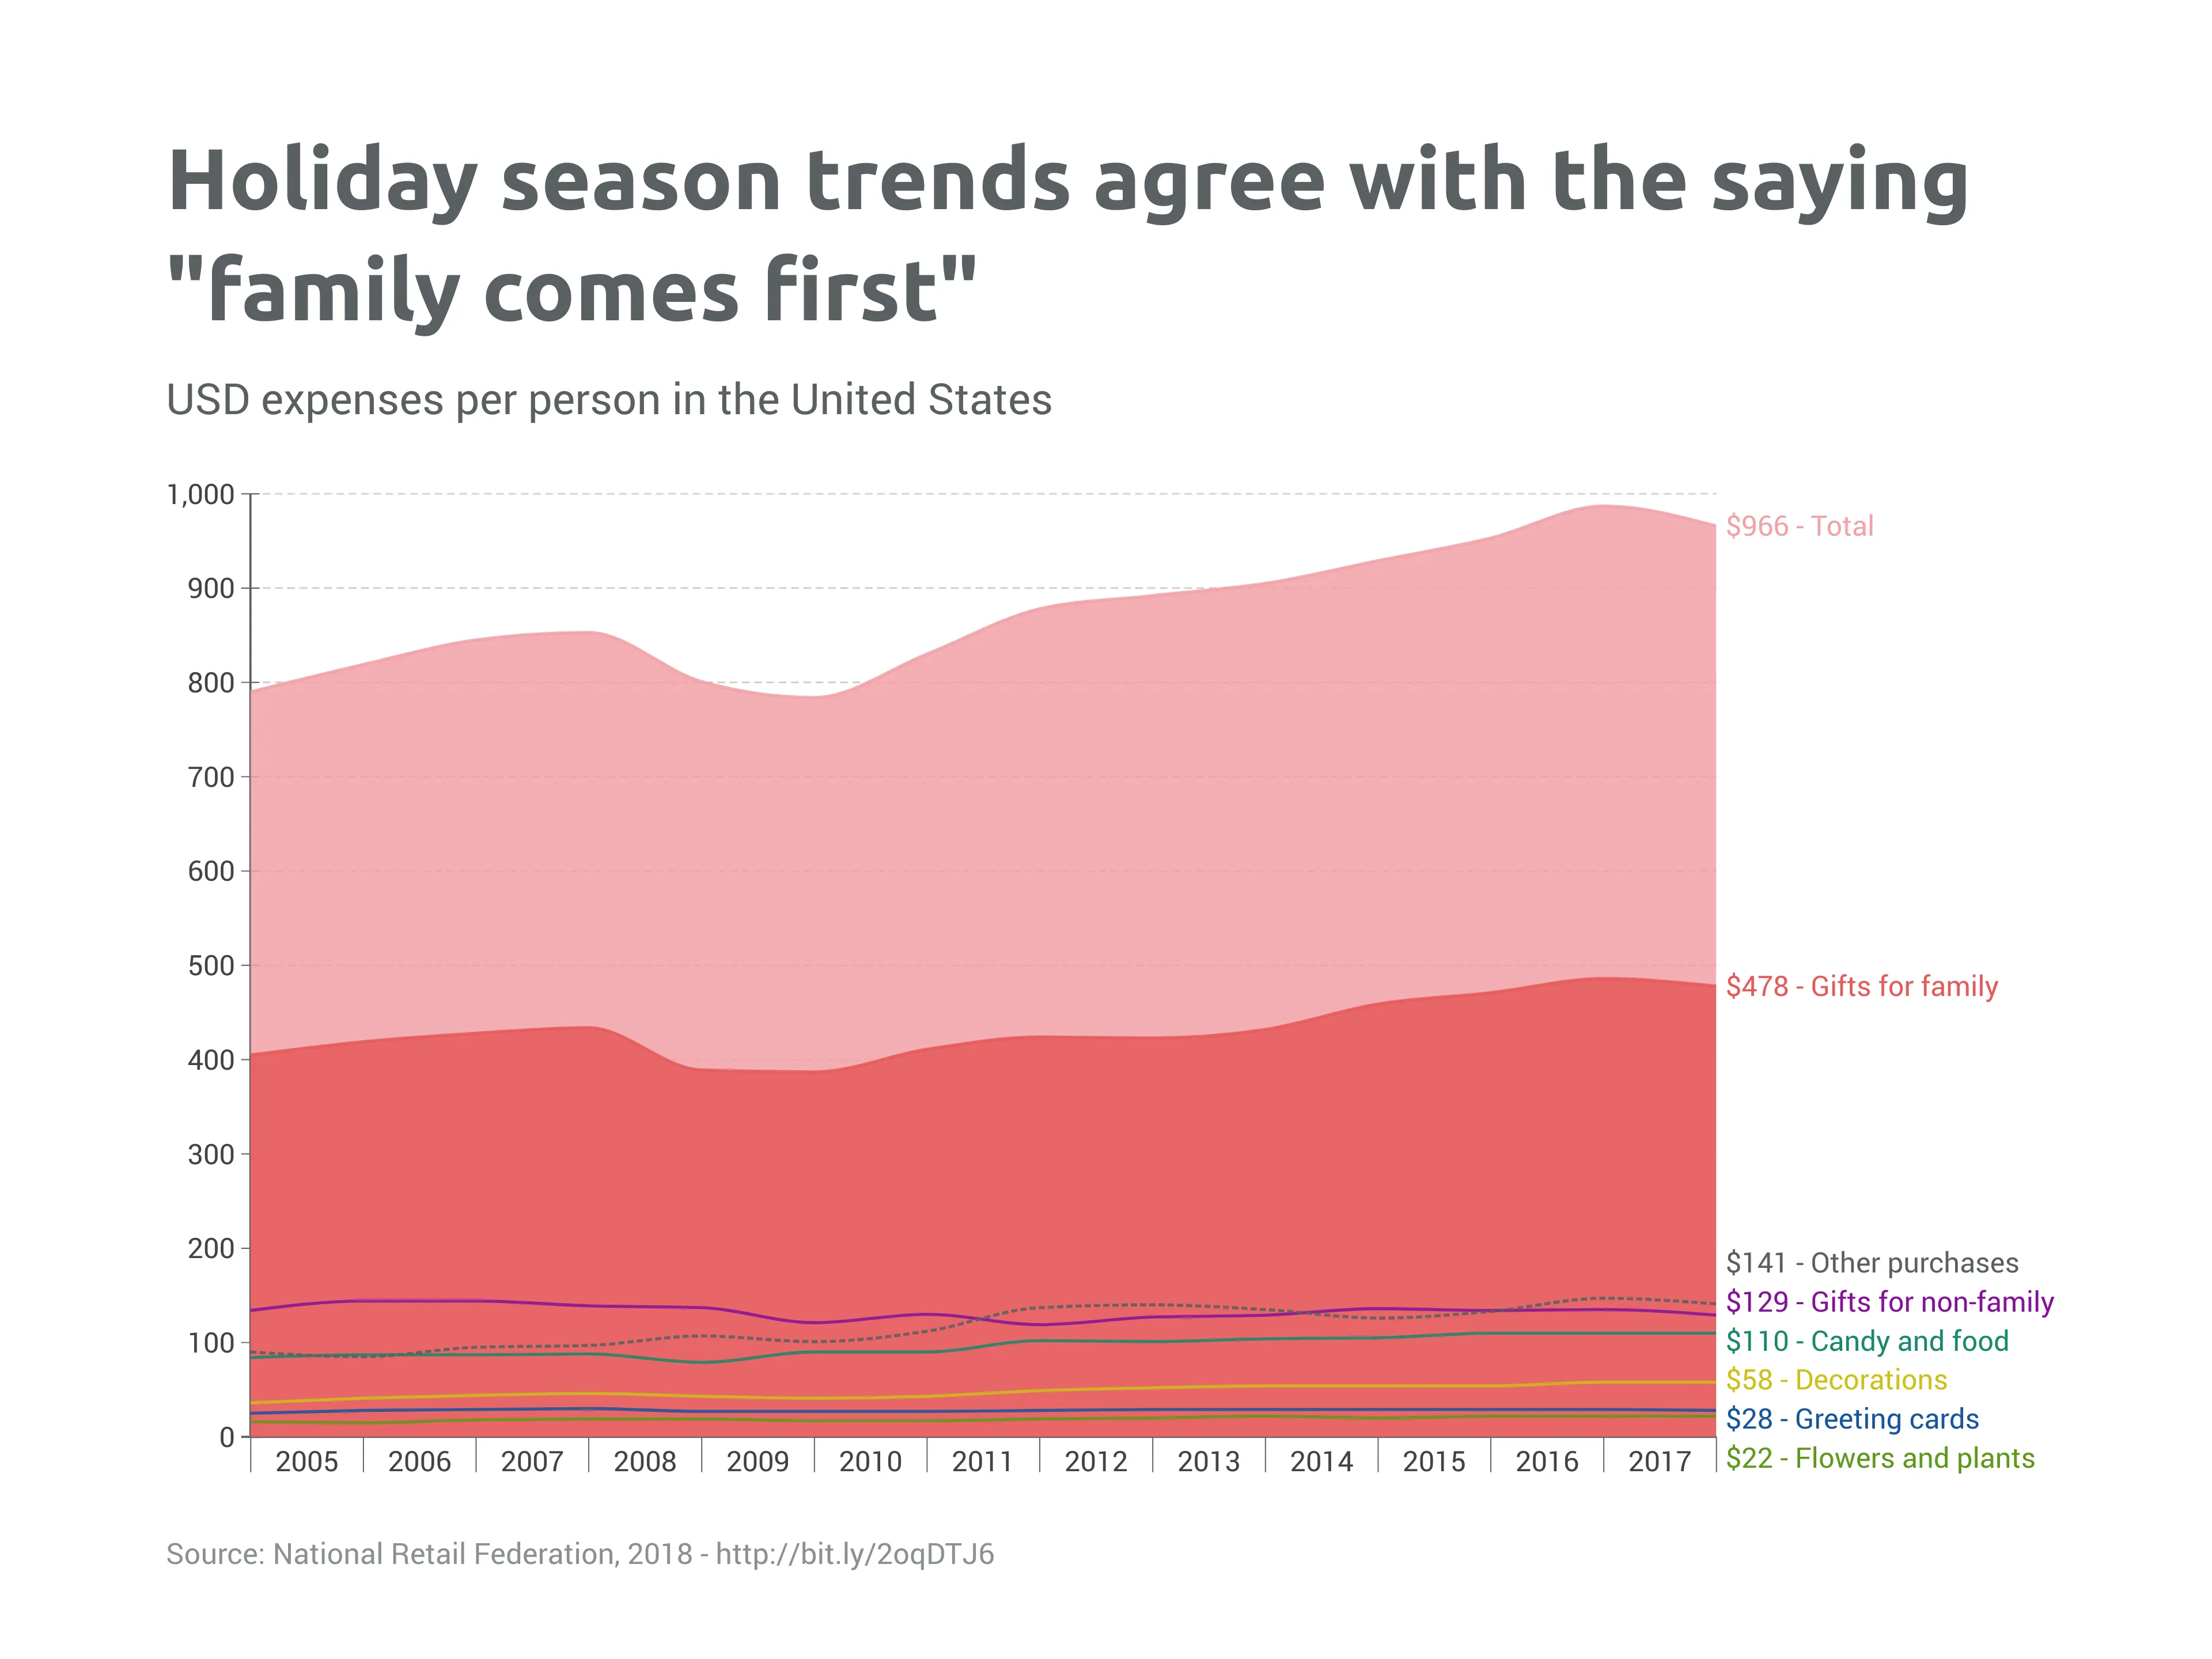
Stacked Area Chart example
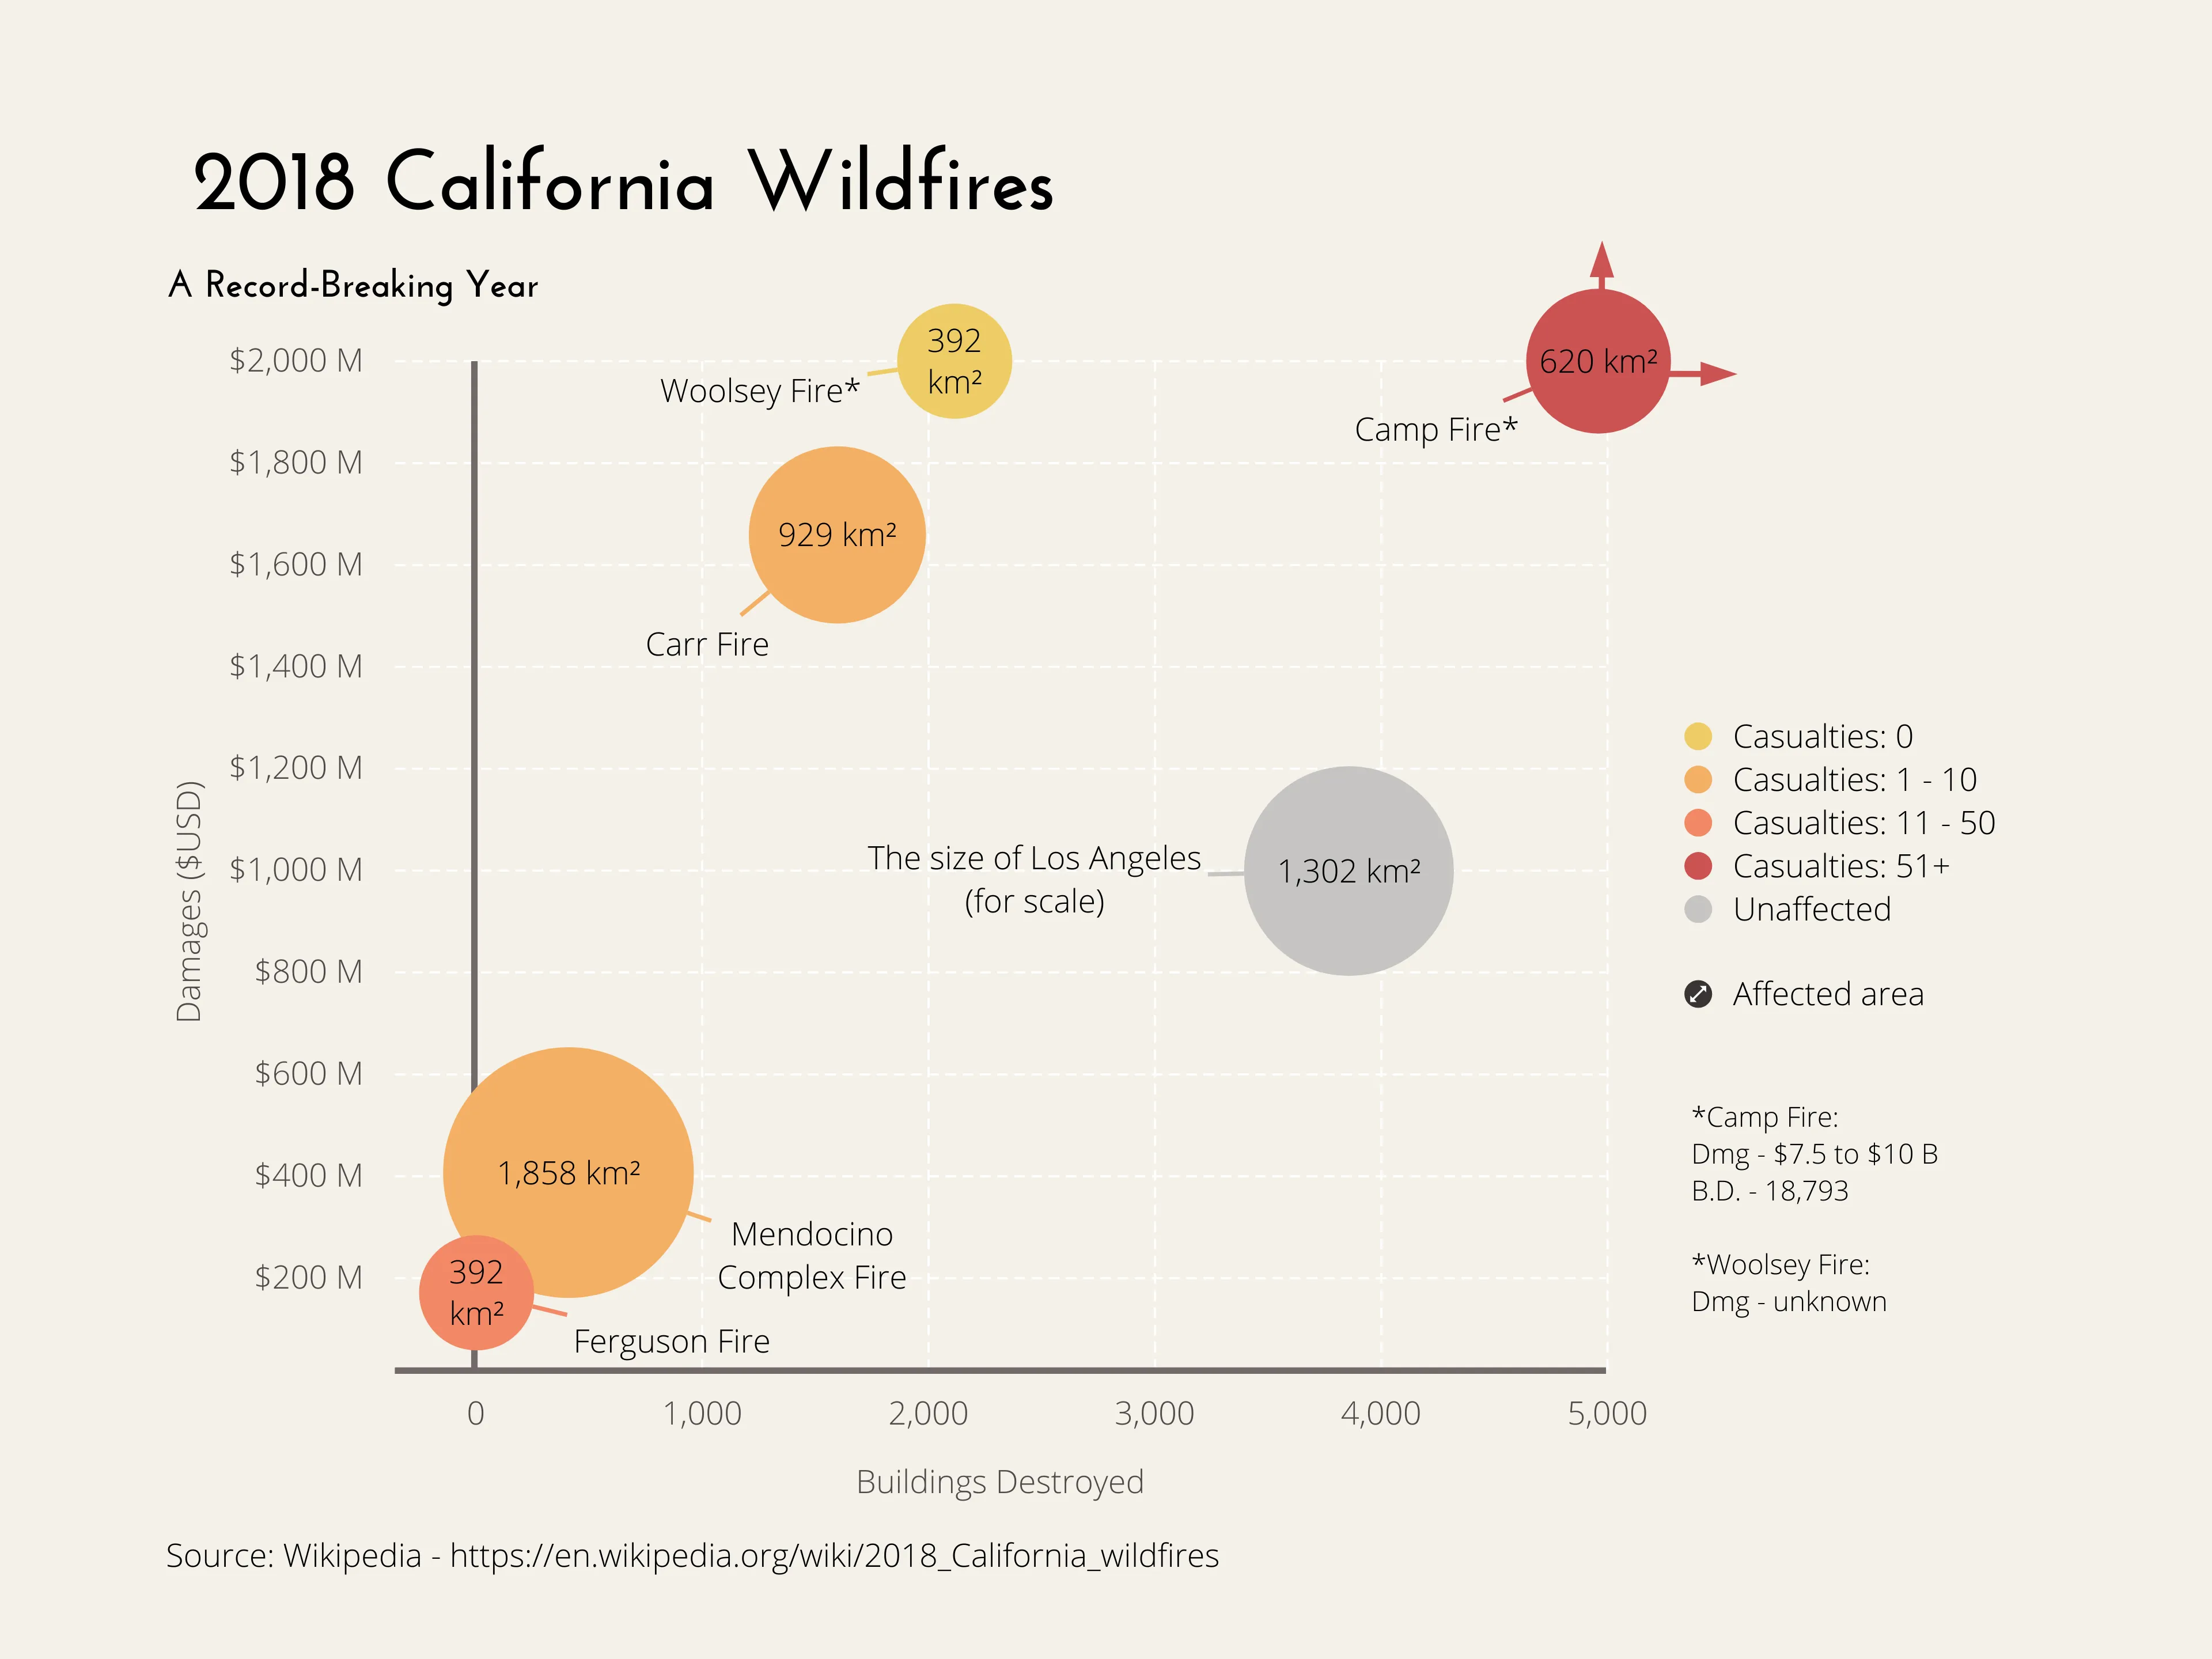
Bubble Chart example
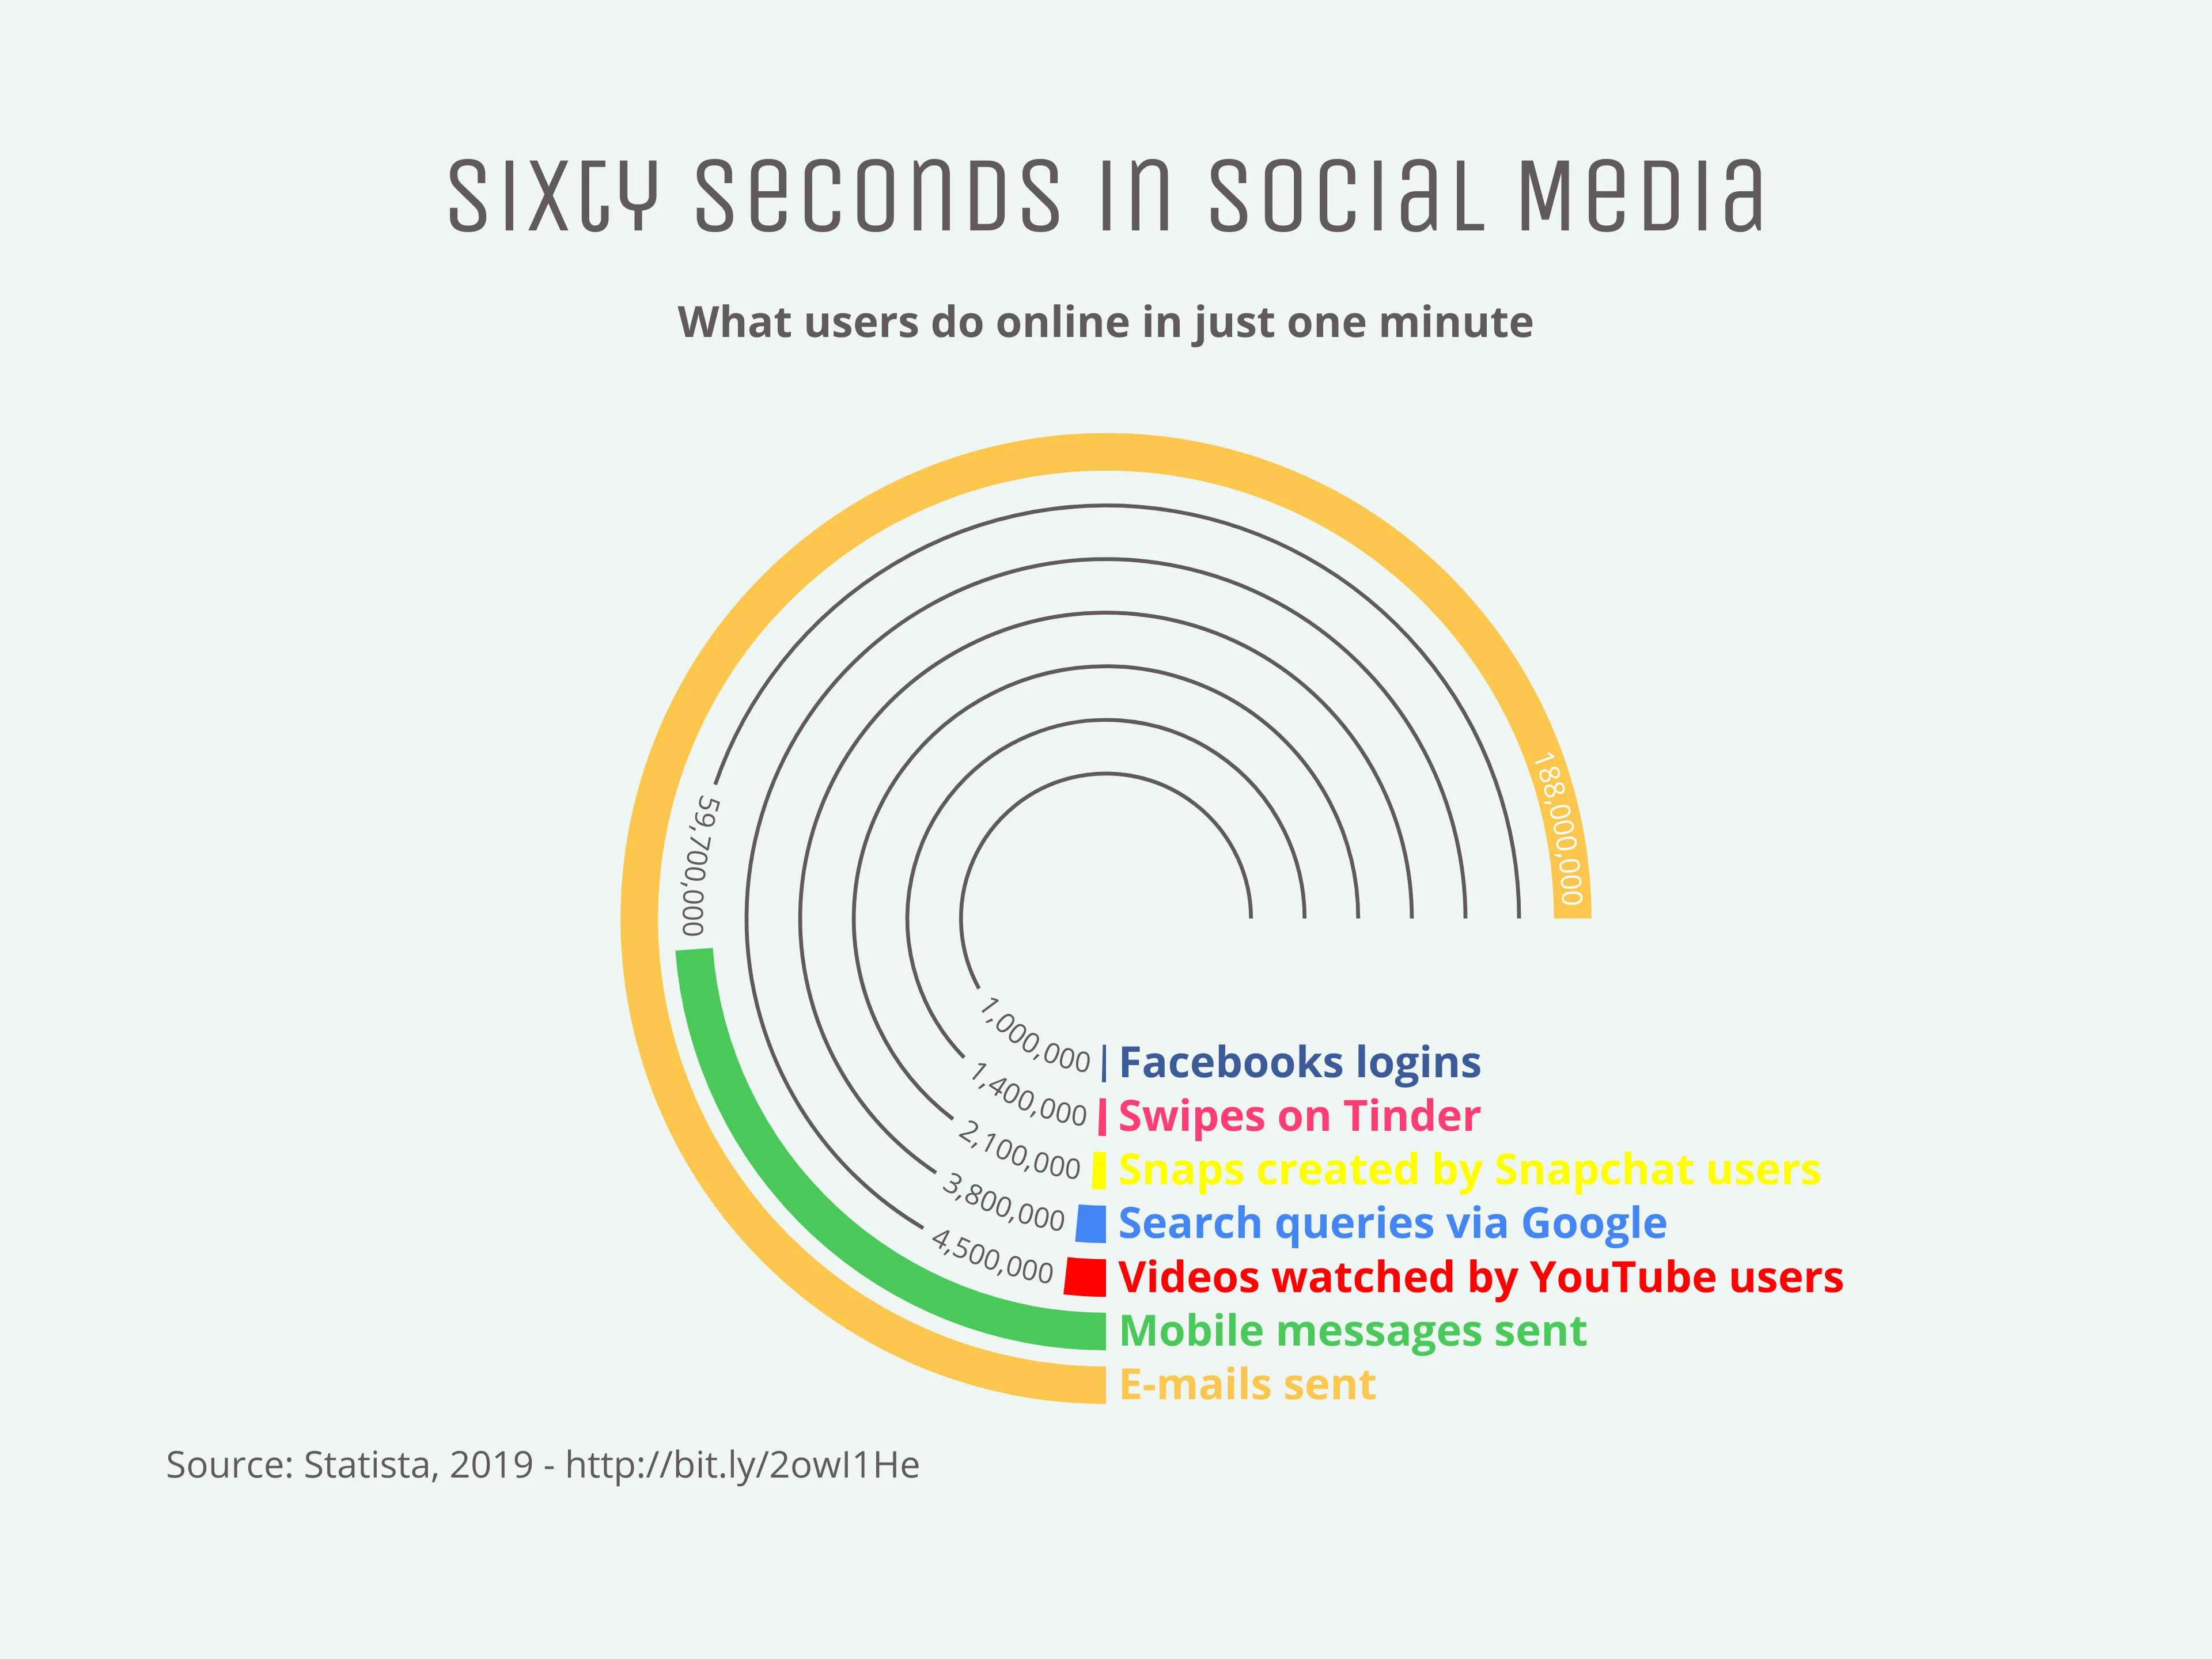
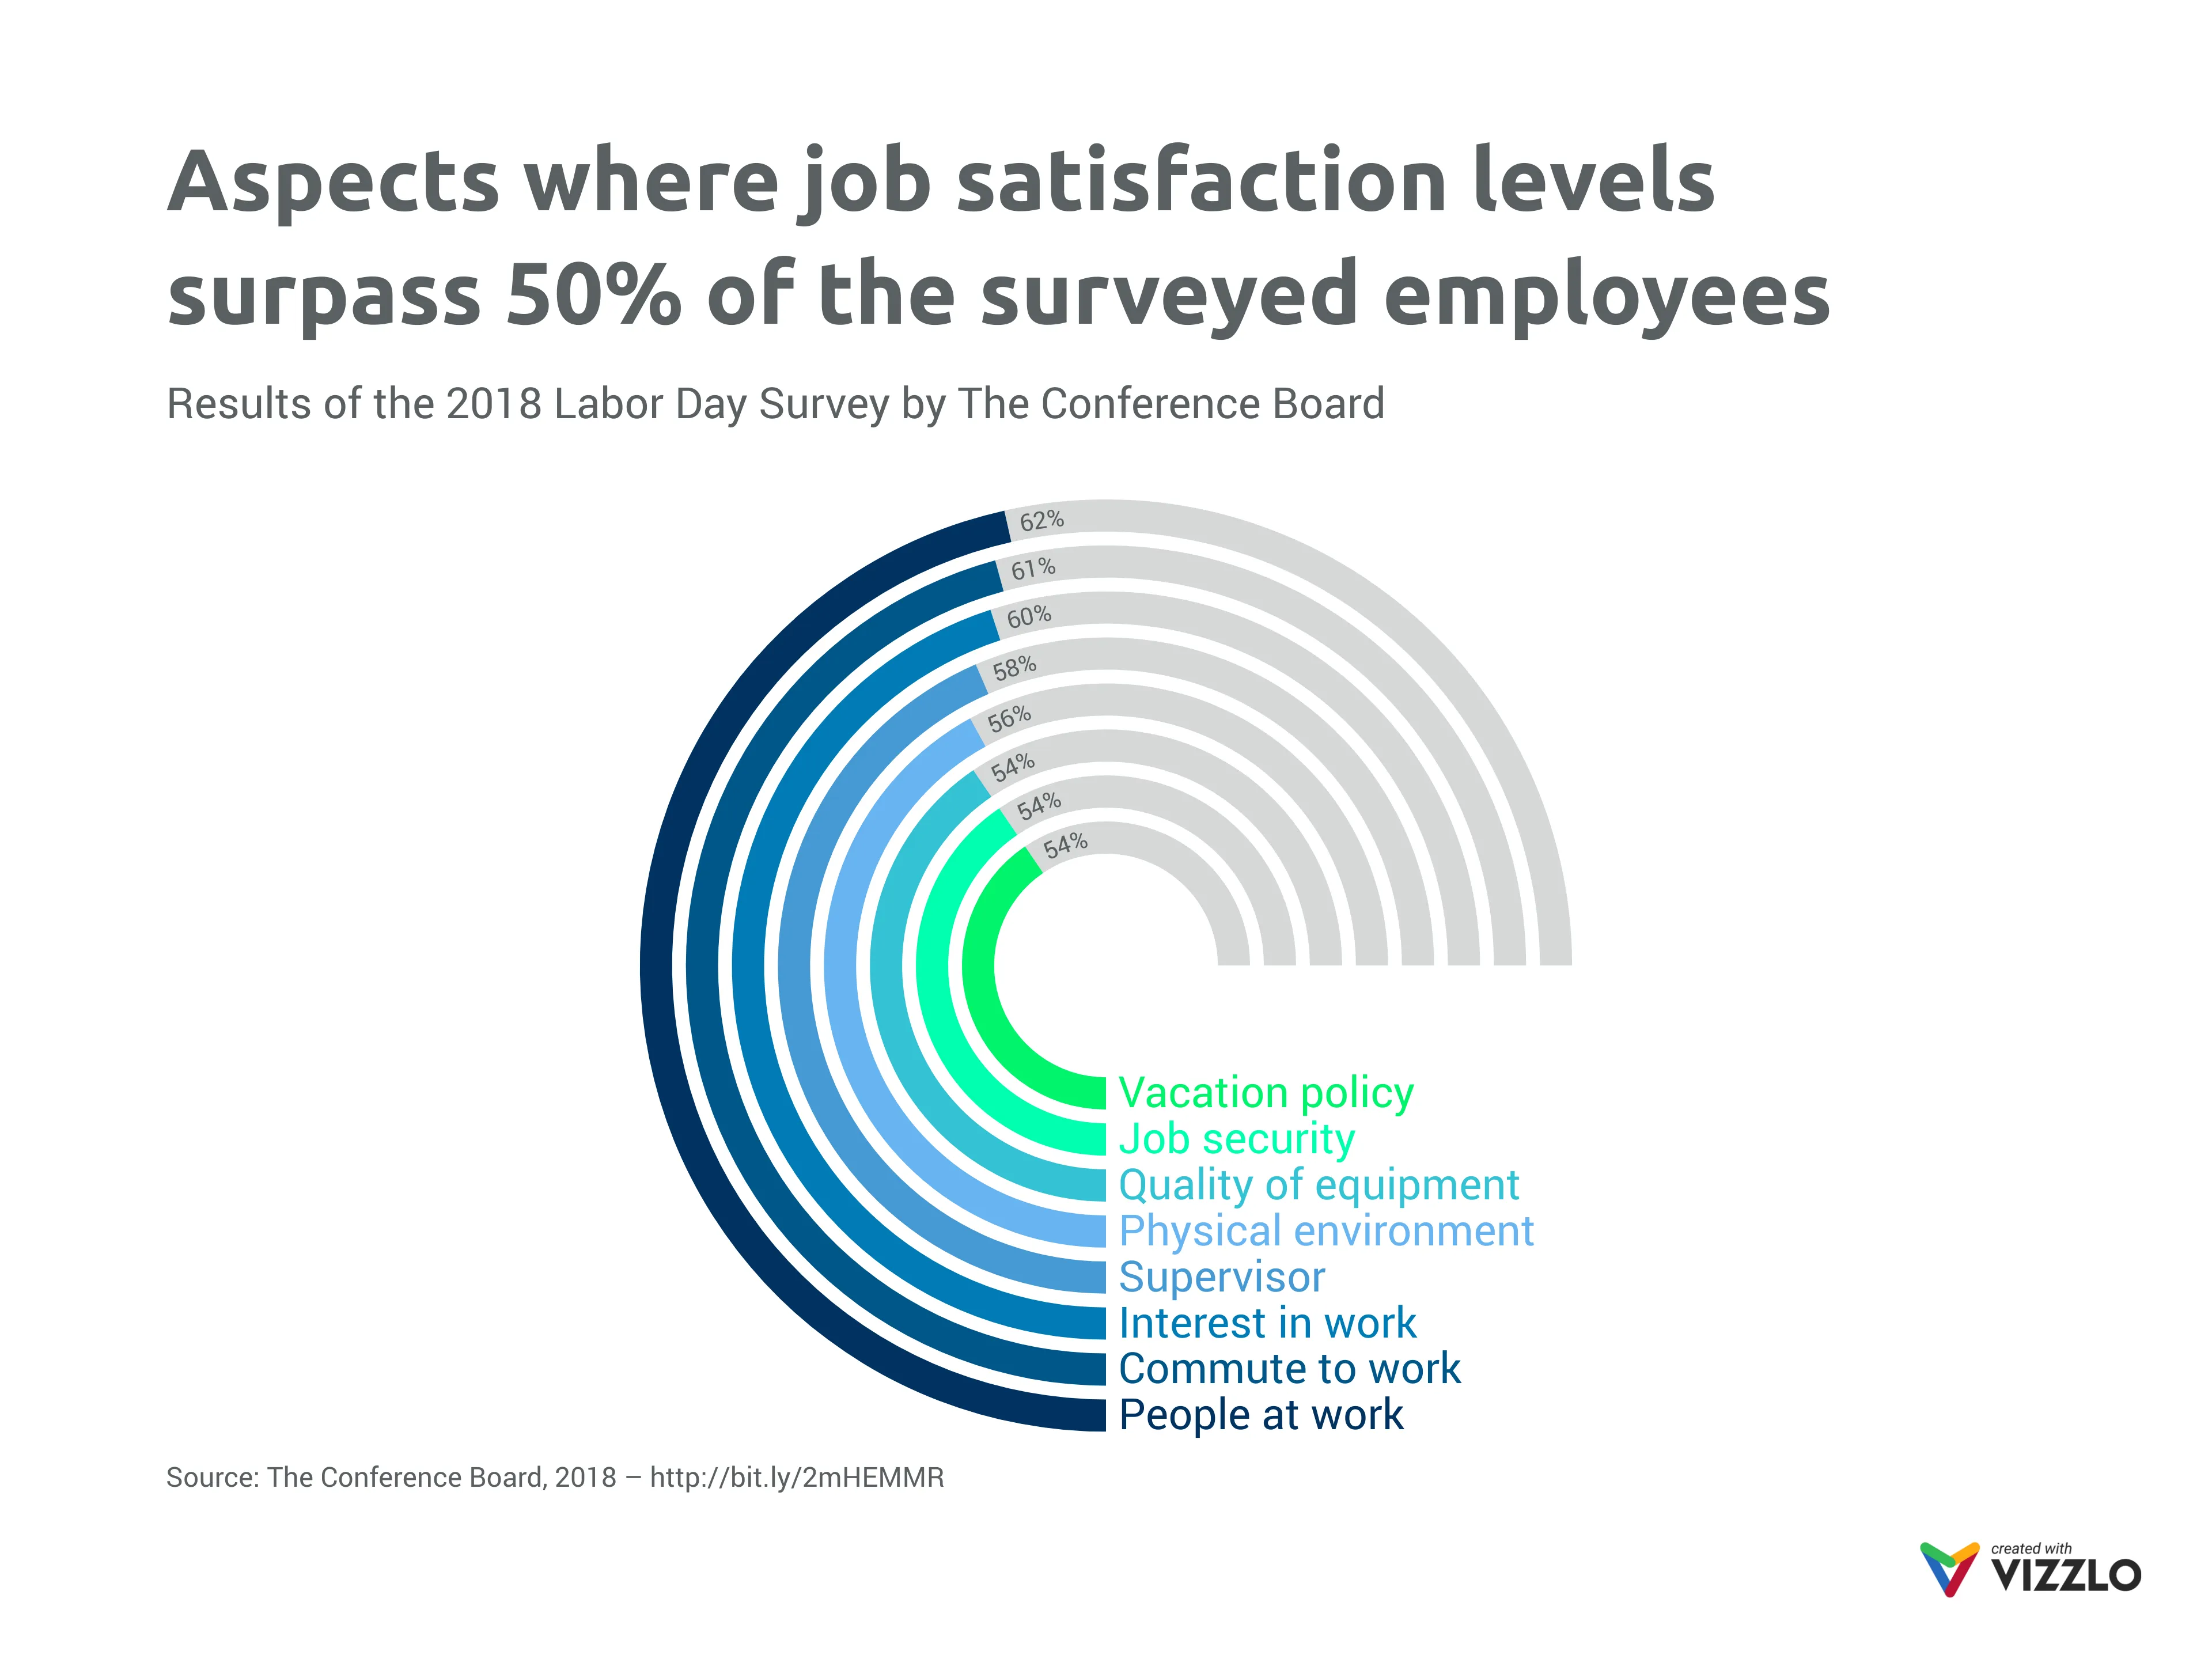
Radial Bar Chart example
Milestones as Arrow example
Venn Diagram example
Timeline Chart example
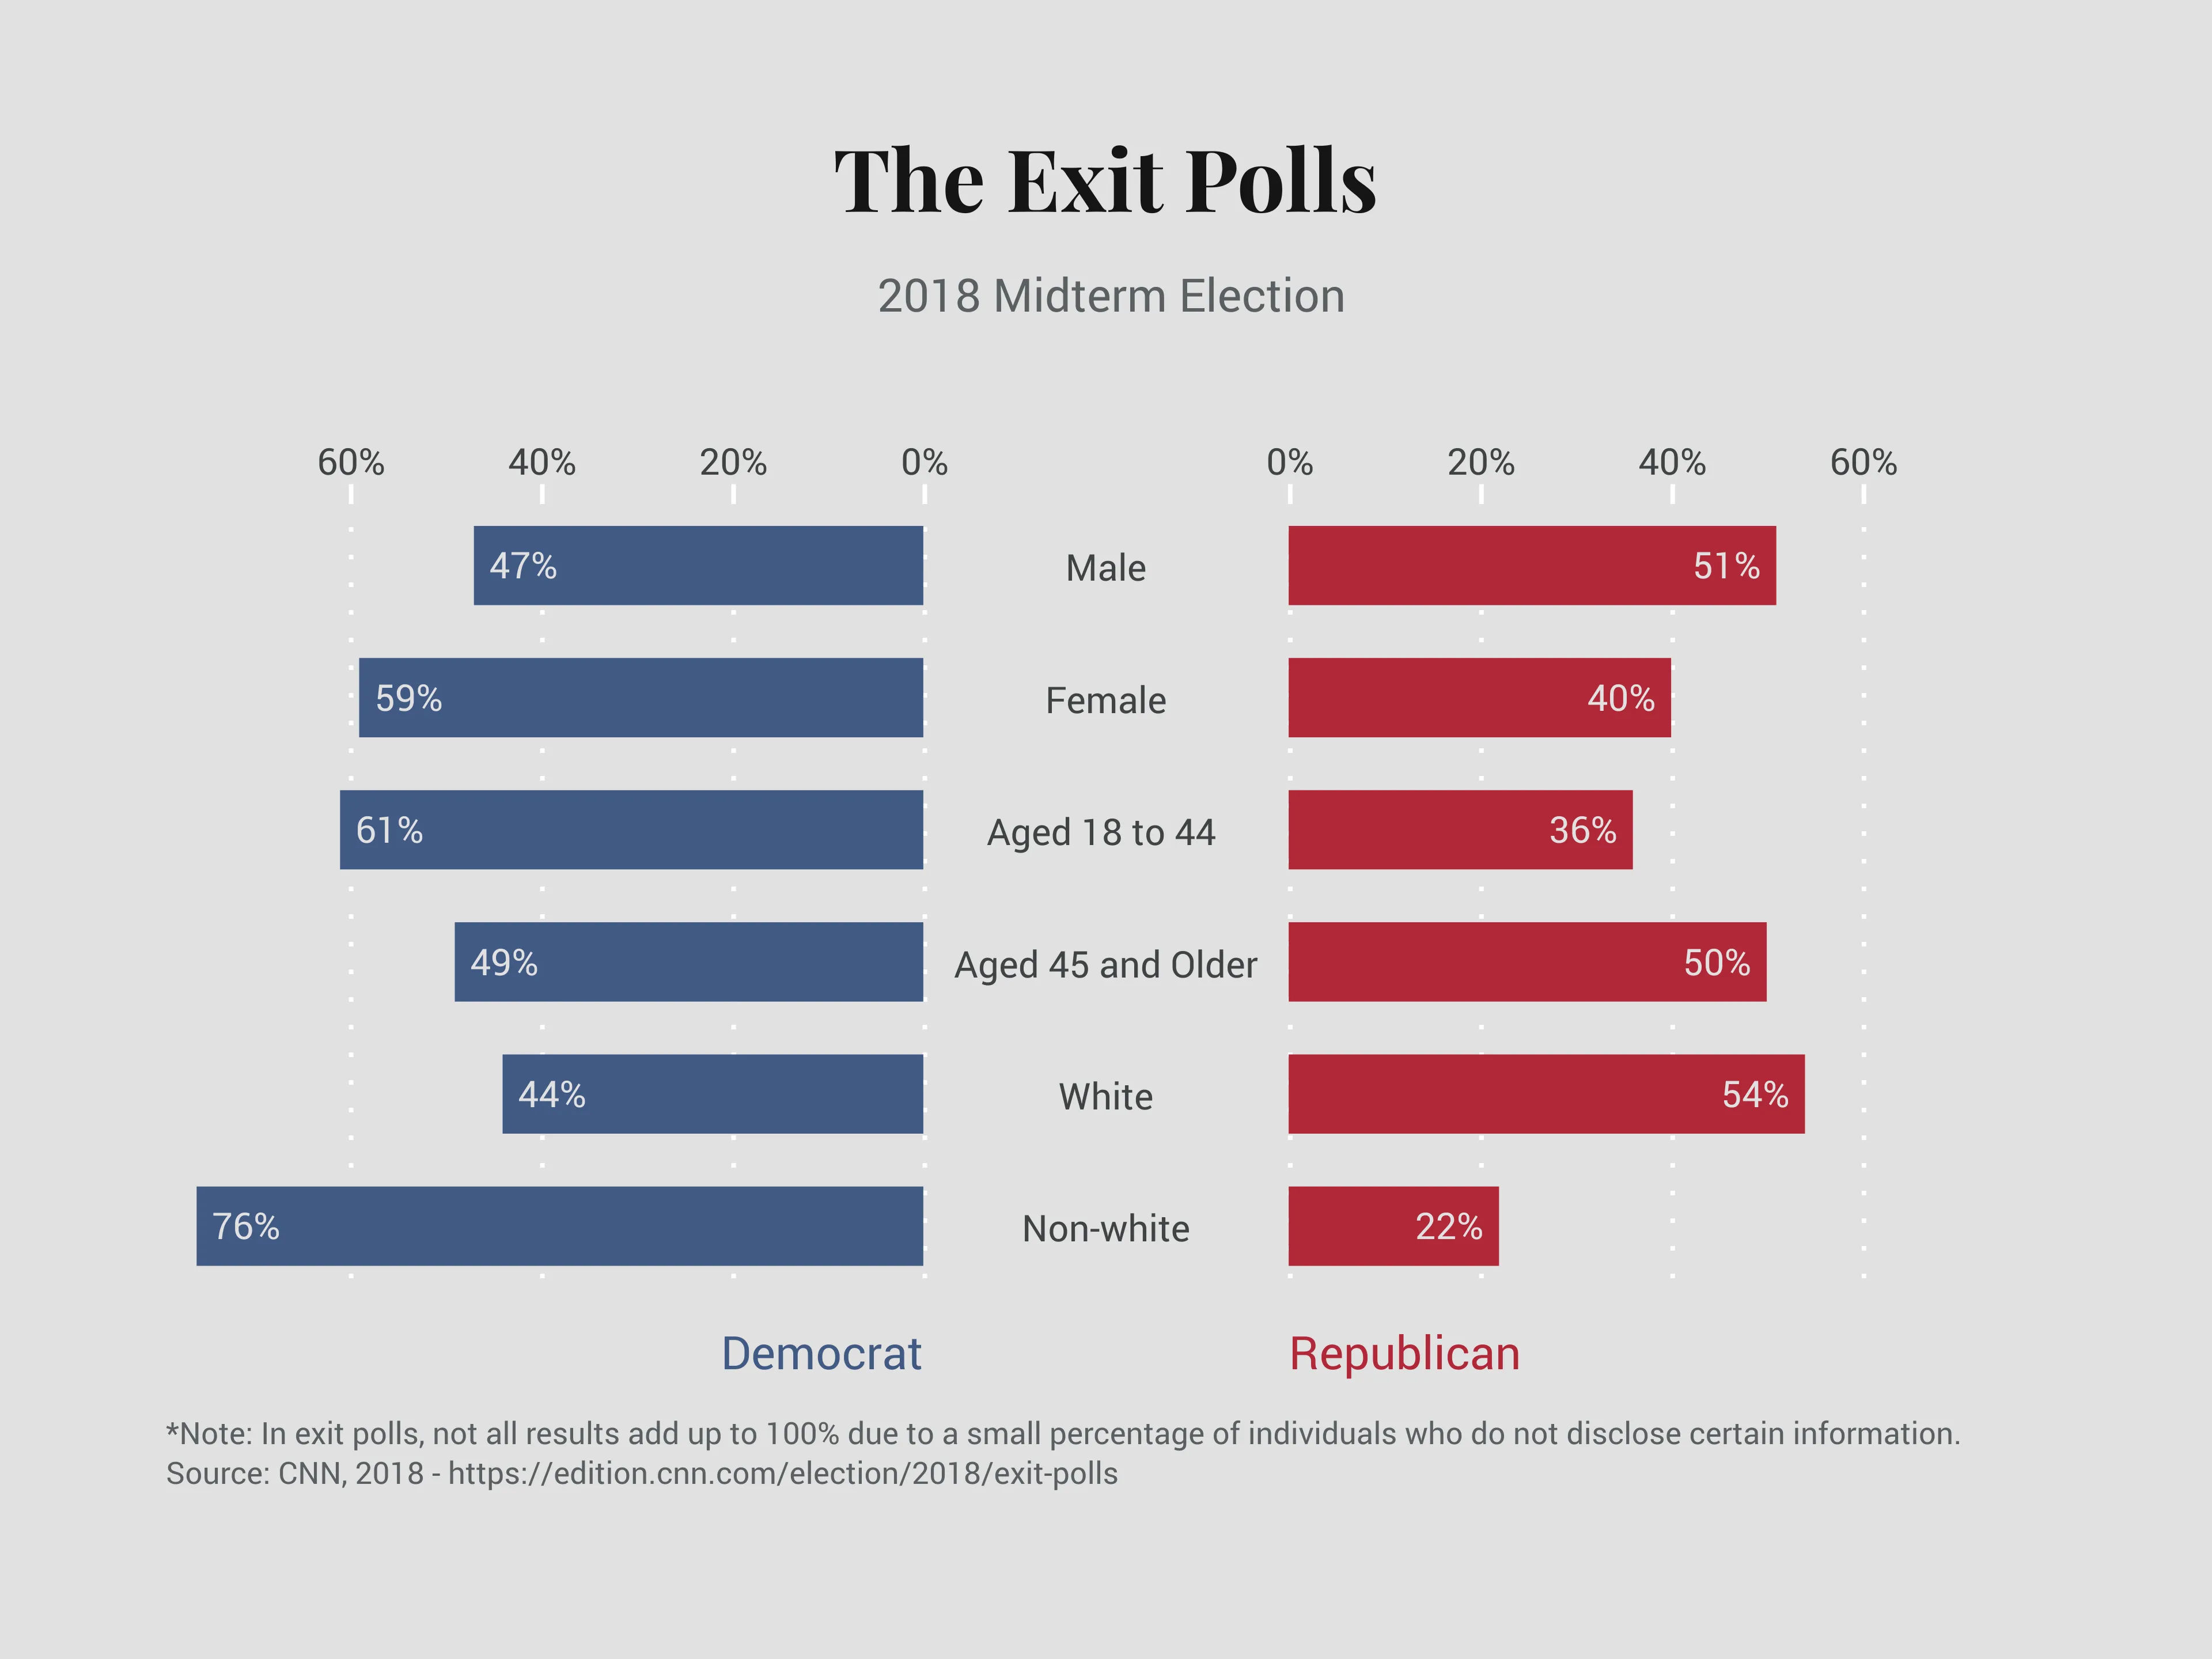
Butterfly Chart example
Project Phase Chart example
Layered Timeline example
Bar Chart example